
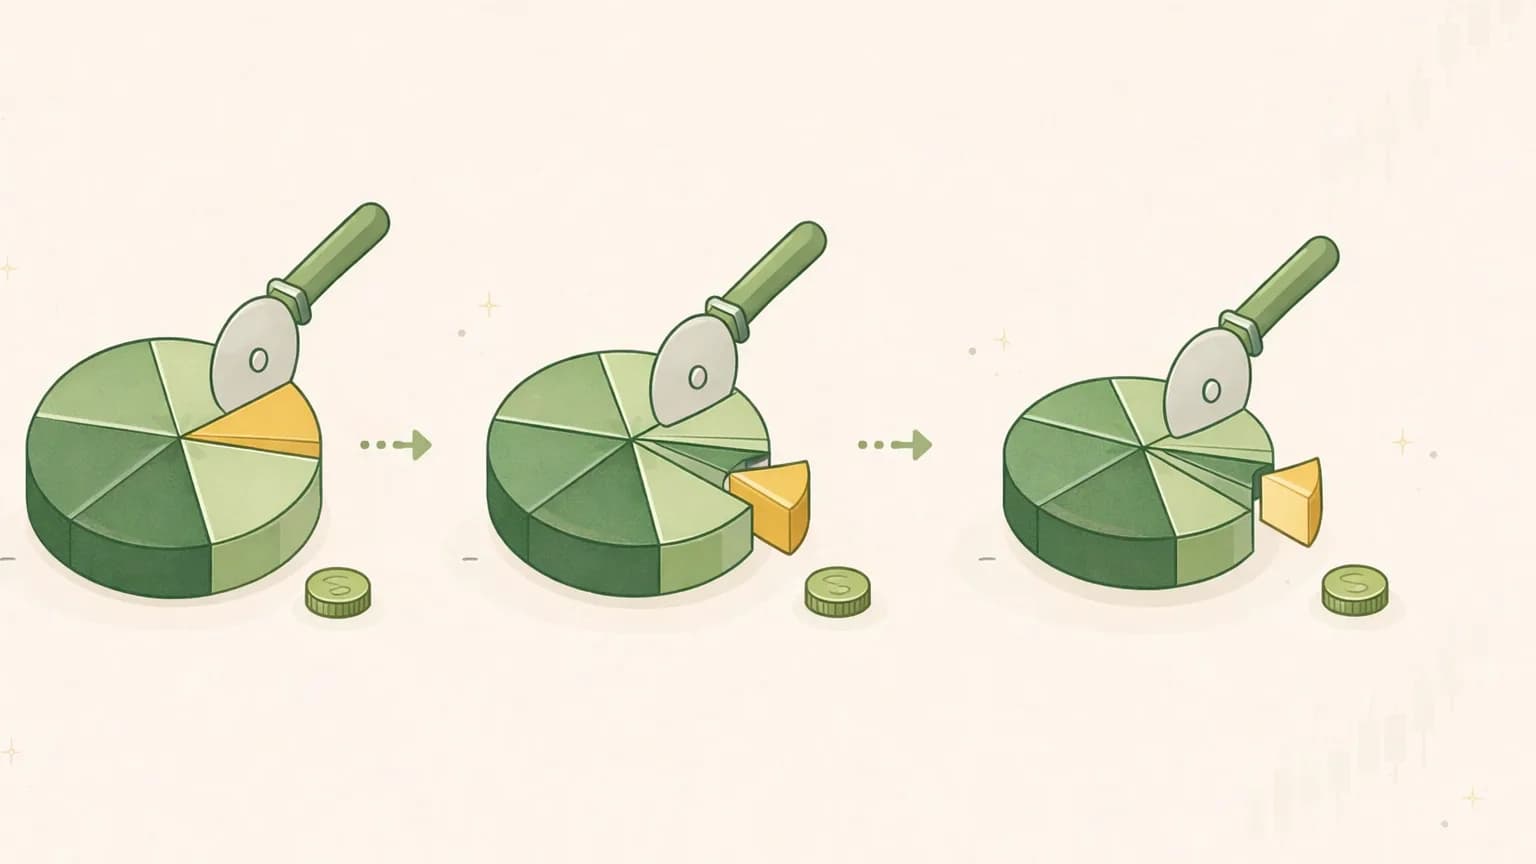
You own a slice of a company when you own its stock. Not a fixed slice — a fraction, and the size of that fraction depends on how many total slices exist. Cut the pie into more pieces and everyone's piece gets smaller, even if the pie itself hasn't changed. That, in one sentence, is stock dilution.
This is one of the quietest ways your ownership erodes, because it rarely makes headlines. A company issues new shares, the total count creeps up, and your same number of shares now represents a little less of the business than it did last quarter. Nothing was taken from your brokerage account. Your claim on the company just got thinner.
Here's stock dilution explained from the ground up: where new shares come from, how to spot dilution in the numbers, why per-share figures matter far more than the totals companies love to headline, and whether buybacks actually cancel it out. The goal isn't a verdict on any stock — it's teaching you to read a share count so it can't quietly work against you.
What dilution actually is#
Dilution is the reduction in each existing shareholder's ownership percentage when a company increases its total number of shares outstanding. The key word is percentage. You can hold the exact same 500 shares for a decade and steadily own less of the company, purely because the denominator kept growing.
A simple illustration (numbers chosen for clean math, not from any real company):
- A company has 100 million shares outstanding. You own 1 million of them — a 1.0% stake.
- The company issues 25 million new shares. Total is now 125 million.
- Your 1 million shares haven't changed. But 1,000,000 ÷ 125,000,000 = 0.8%. Your ownership fell by a fifth without you selling a thing.
That's the mechanical heart of it. Every claim you have on the company — your slice of its profits, its cash flow, its assets, and your vote — is measured against total shares. Grow the total, and your slice shrinks proportionally.
Dilution isn't automatically bad, which is the part most explanations skip. If a company issues 25% more shares and uses the money to grow the business by 50%, each remaining share is backing a bigger, more valuable enterprise. The question is never "did dilution happen?" It's "what did shareholders get in exchange for it?" Sometimes the trade is worth it. Sometimes you paid for nothing.
Where new shares come from#
Dilution isn't one event; it's a category. Several distinct mechanisms all end in the same place — more shares outstanding. Knowing which one is at work tells you a lot about whether it's a healthy trade or a warning sign.
| Source | What happens | What it usually signals |
|---|---|---|
| Secondary offering | The company sells a new batch of shares to the public for cash | Raising money — could be for growth, or to plug a hole |
| Stock-based compensation | Employees are paid in shares and options that convert to stock | Normal at many firms; a red flag when it's large and relentless |
| Convertible debt | Bonds that can convert into shares at a set price | Cheaper borrowing now, potential dilution later |
| Warrants | Contracts giving the holder the right to buy new shares at a fixed price | Common in SPAC deals and financings; dilution triggers if exercised |
| Stock-funded acquisitions | The company pays for another business by issuing its own shares | Growth by purchase, paid for with your ownership |
Secondary offerings#
The most direct form. The company prints new shares and sells them into the market for cash. What matters is the why. Money raised to fund a genuine expansion, an R&D push, or an opportunistic land-grab can be money well spent. Money raised because the business is burning cash and needs to survive is a different story — and repeated offerings from an unprofitable company are one of the more reliable warning signs on the market. It's worth checking whether a company is issuing shares because it wants to or because it has to.
Stock-based compensation#
Paying employees in equity is standard practice, especially in tech, and it can align staff with shareholders. But it's real dilution with a friendly name. Every restricted stock unit that vests and every option that gets exercised adds to the share count. Modest, steady stock comp is a normal cost of doing business. Stock comp that grows faster than revenue, year after year, is shareholders quietly footing an enormous payroll bill in ownership rather than cash. Because it's easy to under-appreciate, we gave it its own deep dive: stock-based compensation explained.
Convertible debt and warrants#
These are dilution on a delay. Convertible bonds let a company borrow at a lower interest rate in exchange for giving lenders the option to convert their debt into shares later. Warrants work similarly — they're the right to buy newly issued shares at a set price. Neither dilutes anyone the day it's signed. But if the stock rises past the conversion or exercise price, those instruments turn into new shares, and the count jumps. This is exactly why the share count you see today can understate what's coming.
Stock-funded acquisitions#
When a company buys another business by issuing its own stock instead of paying cash, existing owners are handing over a piece of their company to fund the deal. This can be perfectly sensible — or it can be a management team using an inflated share price as currency to look bigger. The test is the same as always: did the acquired business add more value than the ownership you gave up to get it?
Basic vs. diluted share count#
Open a company's financials and you'll see two share counts, and the gap between them is one of the most useful things to notice.
- Basic shares outstanding counts the shares that actually exist right now.
- Diluted shares outstanding counts those plus everything that could reasonably become a share — unexercised options, unvested stock units, convertible bonds, and warrants. It's the "what if everything converts" number.
Companies report both because accounting rules require it, and the diluted figure is the more honest picture of your real, fully-loaded claim on the business. A small gap between basic and diluted means limited hidden dilution waiting in the wings. A wide gap means there's a large overhang of potential shares that will land on existing owners if those instruments convert.
How to read it: compare the two counts, and watch the trend over several years. A diluted count that keeps climbing faster than the business grows is dilution in motion. This is also why earnings-per-share is almost always quoted on a diluted basis — it bakes in that future dilution rather than flattering the number. If EPS is unfamiliar territory, start with earnings per share explained, then come back; the two ideas are tightly linked.
Why per-share metrics beat the totals#
Here's the trap dilution sets, and it catches a lot of people.
A company can grow its total revenue, total profit, and total cash flow every single year — and its shareholders can still be getting poorer per share, because the share count grew even faster. The headline says "record revenue." The reality, on the only basis that matters to you as one owner among many, can be decline.
That's why seasoned analysts instinctively convert totals into per-share figures: earnings per share, free cash flow per share, revenue per share, book value per share. Per-share numbers automatically account for dilution, because the share count is right there in the denominator. Totals can hide it. Per-share figures can't.
An illustration (again, clean made-up numbers):
- Year 1: the company earns $100 million in profit on 100 million shares. That's $1.00 of earnings per share.
- Year 2: profit grows to $110 million — a genuine 10% increase. But the company also issued shares, and the count is now 125 million. Earnings per share = $110M ÷ 125M = $0.88.
Total profit went up 10%. Your earnings per share went down 12%. Both facts are true at once, and only one of them shows up in the press release. A business growing its totals while shrinking its per-share figures is running up a down escalator. The same logic applies to cash: if you're weighing free cash flow, do it per share — see free cash flow explained for why that figure is so hard to fake and so easy to misquote.
The practical habit: whenever you see a company celebrate a "total" number, ask what happened to the same figure per share. If management only ever talks in aggregates and never in per-share terms, that's a tell worth noticing.
Do buybacks cancel out dilution?#
Buybacks are dilution in reverse. When a company repurchases its own shares and retires them, the total count falls, so each remaining share represents a slightly larger slice of the business. Same pie, fewer pieces.
The tidy math (illustrative): a company with 100 million shares buys back 5 million and retires them, leaving 95 million. If profit holds at $100 million, EPS rises from $1.00 to $100M ÷ 95M ≈ $1.05, purely from the smaller denominator. You now own marginally more of the company than you did, without buying a single additional share.
So in principle, buybacks can offset dilution. In practice, you have to check whether they actually do — and this is where a lot of companies quietly disappoint their owners:
- Net vs. gross. A company can spend billions buying back stock while still letting its share count drift up, because stock-based compensation is issuing new shares faster than the buyback retires old ones. The buyback isn't rewarding you; it's just mopping up the dilution from employee pay. Always look at whether the share count actually fell — not just at the dollars spent repurchasing.
- Price paid. Buying back shares when they're expensive can destroy value even as it lowers the count. A buyback is only a good use of cash if the shares were bought for less than they're worth.
There's real nuance here, and the buyback story is often the opposite of what the headline suggests. We unpack it fully in stock buybacks explained. The short version for dilution purposes: don't assume a buyback offsets dilution — verify it against the diluted share count.
How to check dilution on any company#
You don't need special tools to run this. A few minutes with a company's filings covers it:
- Pull the share count over 3–5 years. Is it flat, rising slowly, or climbing steadily? A count that grows a few percent a year, year after year, quietly compounds against you.
- Compare basic to diluted. A wide, widening gap flags a large overhang of options, convertibles, and warrants waiting to convert.
- Read the stock-based-compensation line. Is it modest, or is it a big and growing share of revenue?
- Check for convertibles and warrants in the filings — the future dilution that isn't in the current basic count yet.
- Convert the story to per-share terms. Did revenue, earnings, and free cash flow per share actually grow, or just the totals?
Where a research desk does the counting for you#
Tracking all of this by hand — share counts across years, the basic-versus-diluted gap, stock comp trends, buried convertibles, per-share conversions — is exactly the kind of unglamorous, easy-to-skip work that dilution relies on you skipping.
Valarn is built to do that work as an educational research tool. Instead of one AI handing you a confident paragraph, it runs up to about 25 specialist analysts across areas like financial quality, cash flow, valuation, and ownership — each interrogating one slice of a company. Its financial-quality and cash-flow analysts look specifically at share-count trends, stock-based compensation, and whether per-share metrics are keeping pace with the totals, rather than taking a headline "record revenue" at face value. You can see how that reads on a real company in a complete sample research report, or orient yourself on any ticker from a company research page.
Every factual claim — including the share counts — is traceable to a filing with an as-of date, and the analysts stage a structured bull-versus-bear debate before synthesizing a single neutral research view (Bullish, Cautious Bullish, Neutral, Cautious, or Bearish — never a buy or sell instruction). Each report carries a 0–100 confidence score reflecting data quality, not a price prediction, and a quality gate runs before anything reaches you. If a term trips you up along the way, the Valarn glossary defines it in plain language. When you want to see it on a company you care about, you can run your own free research report.
The bottom line#
Dilution is the slow leak in stock ownership. It rarely announces itself, it hides behind rising "total" numbers, and it can turn a company that's genuinely growing into a poorer deal for each individual owner. The defense is simple to state and easy to forget: watch the share count, mind the gap between basic and diluted, and judge everything on a per-share basis rather than the totals in the headline.
Do that, and the pie-slicing works for you instead of against you — because you'll actually notice when your slice is getting thinner, and you'll know to ask what you got in return.
Valarn is an educational research tool, not investment advice. It does not tell you to buy, sell, or hold anything, and nothing here is a recommendation or a promise of results. Always do your own research and consider consulting a licensed financial professional.
Valarn
Research
Valarn Research Team

Try Valarn for free
Run AI-powered analysis on any stock — typically 5–20 minutes per report.