
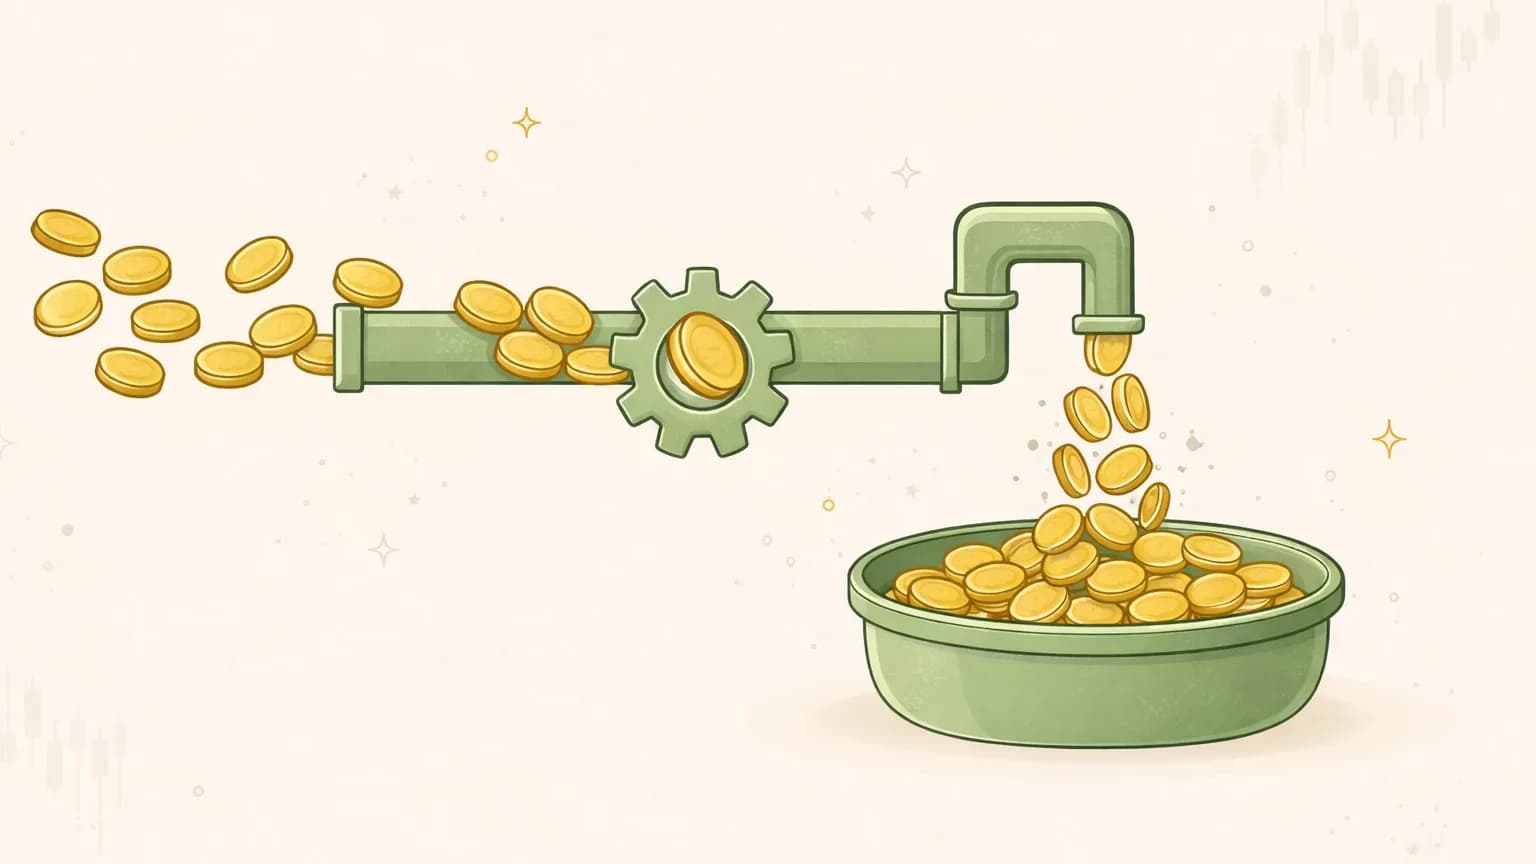
Free cash flow is one of those terms that gets thrown around constantly and understood rarely. Analysts quote it, headlines celebrate it, and half the people nodding along couldn't tell you exactly what it measures or why it matters more than the profit number sitting right next to it.
So here's free cash flow explained properly — not as a definition to memorize, but as a lens for answering the question that actually matters about any company: after it pays for everything it needs to keep running and growing, how much genuine, spendable cash is left over?
That leftover cash is what pays dividends, buys back stock, pays down debt, and funds the next acquisition. It's the money a business can actually do something with. Earnings can be massaged; this is much harder to fake. Let's break down what it is, how to read it, and why a profitable company can still generate almost none of it.
What free cash flow actually is#
The formula is refreshingly simple:
Free cash flow (FCF) = Operating cash flow − Capital expenditures
Take the cash the business generated from its actual operations, subtract the money it had to spend on physical assets to keep the lights on and grow, and what's left is free cash flow. "Free" doesn't mean it appeared from nowhere — it means it's unencumbered, available to return to shareholders or reinvest at management's discretion rather than being already committed to running the business.
Both inputs come from the cash flow statement, the third of the three financial statements and, for this purpose, the most honest one. The income statement tells you about profit; the balance sheet tells you about position; the cash flow statement tells you what literally moved in and out of the bank. If you want the wider context for where this sits, our 12-step research checklist walks through how cash flow fits alongside the business model, moat, and valuation.
Let's take the two pieces one at a time, because each tells its own story.
Operating cash flow: the raw cash engine#
Operating cash flow (sometimes "cash flow from operations" or CFO) is the cash a company produced from its core business over a period. It starts from net income and then strips out the accounting fictions — adding back non-cash charges like depreciation, and adjusting for changes in working capital (money tied up in inventory and unpaid customer invoices, versus money the company itself hasn't paid out yet).
That working-capital adjustment is where a lot of the truth lives. A company can book a sale — counting it as revenue and profit — before the customer has paid a cent. Operating cash flow corrects for that: if receivables are ballooning because customers aren't paying, cash flow comes in below profit and the gap is visible. This is exactly the kind of tension covered in more depth in our note on earnings quality.
The short version: operating cash flow answers "did the business's day-to-day activity actually produce cash?" It's a big step closer to reality than reported profit — but it isn't the finish line, because it ignores what the company had to spend just to stay in the game.
Capex: the cost of staying in business#
Capital expenditures — capex — is the money a company spends on long-lived physical assets: factories, servers, machinery, stores, delivery trucks, fiber. On the cash flow statement it usually appears as "purchases of property, plant and equipment" under investing activities.
Capex isn't optional in the way it sometimes gets treated. It's genuinely spent cash that left the building, and a business that stops investing in itself will eventually stop functioning. That's why we subtract it: cash the company had to commit to maintaining and expanding its asset base isn't really "free" for anything else.
It helps to split capex into two mental buckets:
- Maintenance capex — what's required just to keep existing operations running at their current level. Replacing worn-out equipment, refreshing aging stores. This is the non-negotiable floor.
- Growth capex — spending aimed at expanding the business: new plants, new capacity, new markets.
Companies rarely disclose the split cleanly, but the distinction matters enormously for interpretation. A business swallowing huge capex to grow is a very different animal from one bleeding cash just to stand still — even if their reported free cash flow looks identical. Hold that thought; it's the key to reading negative FCF correctly later.
Free cash flow vs net income: why profit isn't cash#
Here's the heart of it. Net income (profit, the "bottom line" of the income statement) and free cash flow are trying to describe the same business, but they're built on completely different foundations — and they routinely disagree.
Net income is an accrual measure. It records revenue when it's earned and expenses when they're incurred, regardless of when cash changes hands. It also runs a big non-cash expense — depreciation — through the income statement, and it can be shaped by dozens of legitimate accounting choices. Net income is, as the saying goes, an opinion.
Free cash flow is closer to a fact: it tracks cash that actually moved.
The two diverge for concrete, checkable reasons:
- Depreciation reduces profit but isn't a cash outflow this period — so it tends to push cash above profit.
- Capex is real cash out the door but isn't fully expensed on the income statement the year it's spent — so it pushes free cash flow below profit.
- Working capital swings (inventory building up, customers paying slowly) can drain cash even in a profitable year.
- Stock-based compensation is a real expense that reduces profit but uses no cash, which is one reason it deserves scrutiny — more on that in stock-based compensation explained.
Here's the contrast at a glance:
| Net income | Free cash flow | |
|---|---|---|
| Basis | Accrual accounting | Actual cash movement |
| Includes depreciation? | Yes, as an expense | Added back (non-cash) |
| Includes capex? | Only gradually, via depreciation | Yes, full cash amount |
| Affected by working capital? | Not directly | Yes, directly |
| How easy to shape with accounting choices? | Relatively easy | Much harder |
| What it best answers | "Is the business profitable on paper?" | "How much spendable cash did it actually produce?" |
Neither number is "the right one." Profit tells you about earning power over time; free cash flow tells you what hit the bank. You want to look at both — and, crucially, at whether they agree.
Cash conversion: does profit turn into cash?#
That agreement has a name: cash conversion. It asks, over time, does reported profit actually show up as cash? One common way to express it is free cash flow divided by net income.
Let's make it concrete with an illustrative example (these numbers are invented to show the mechanics, not describing any real company):
- Operating cash flow: $500M
- Capital expenditures: $150M
- Free cash flow: $500M − $150M = $350M
- Net income: $300M
- Cash conversion: $350M ÷ $300M = 1.17, or about 117%
A ratio around or above 1.0 means profit is translating fully into cash — a healthy sign. A ratio persistently and well below 1.0 is the yellow flag: the company keeps reporting profits that never materialize as cash. Over a single quarter that can be noise (a big inventory build, a timing quirk). Sustained over years, it's the classic signature of aggressive revenue recognition, deteriorating collections, or profits that exist mainly on the income statement.
This is precisely the check you run when reading a quarterly report — comparing the profit headline against the cash reality underneath. Our earnings report checklist makes that comparison one of its core steps, because a beat on profit that doesn't show up in cash flow is worth a second look.
FCF margin: sizing it against revenue#
A raw dollar figure means little without context — $350M of free cash flow is enormous for a small company and a rounding error for a giant. FCF margin provides that context by scaling free cash flow to revenue:
FCF margin = Free cash flow ÷ Revenue
Using the numbers above, if that company had $2,000M in revenue:
$350M ÷ $2,000M = 17.5% FCF margin (illustrative).
That means for every dollar of sales, the business converted 17.5 cents into free cash. FCF margin lets you compare cash generation across companies of wildly different sizes and track a single company's efficiency over time. A rising FCF margin usually signals a business getting more cash-generative as it scales; a falling one can flag rising costs, heavier reinvestment, or eroding pricing power. As always, compare within an industry — a capital-light software firm and a capital-heavy manufacturer live in different worlds.
What negative free cash flow can mean#
Here's where interpretation matters most, because negative free cash flow is genuinely ambiguous — it can be a warning sign or a sign of ambition, and telling them apart is the whole skill.
The healthy version: heavy investment. A fast-growing company might generate solid operating cash flow but pour even more into growth capex — building out capacity, infrastructure, or footprint ahead of demand. Amazon spent years with thin or negative free cash flow while it was building warehouses and data centers, and that spending later underwrote enormous cash generation. Negative FCF by choice, funded by a strong balance sheet and aimed at expanding a proven, profitable model, is investment, not distress.
The unhealthy version: trouble. The same negative number means something very different when it's driven by shrinking operating cash flow, when the company has to keep raising debt or issuing shares to plug the gap, or when the business isn't actually profitable and is burning cash just to keep operating. Here, negative free cash flow is a countdown clock — the company depends on outside financing to survive, and that financing can dry up.
The questions that separate the two:
- Is operating cash flow positive and growing, or negative and shrinking? Growth capex on top of strong CFO is a different story than a core business that can't generate cash.
- What's funding the gap — a fortress balance sheet and prior cash reserves, or an escalating reliance on new debt and share issuance (which quietly dilutes existing owners — see stock dilution explained)?
- Is the underlying business actually profitable, with the cash drain coming from deliberate expansion? Or is it structurally unprofitable?
Negative free cash flow is never a verdict on its own. It's a question that sends you to the balance sheet, the growth rate, and the story management is telling about why.
How a research process reads cash flow#
Free cash flow rarely lives in isolation — its meaning comes from the context around it, which is a lot of separate threads to hold at once: operating cash flow trends, the capex split, working-capital swings, cash conversion over multiple years, and the financing that funds any shortfall. It's exactly the kind of multi-angle analysis that's easy to shortcut when you're doing it by hand.
This is where a structured research tool earns its place. Valarn was built to run that full analysis as an educational research tool: up to about 25 specialist AI analysts across five categories — including dedicated financial-quality and cash flow perspectives — each interrogating one slice of the picture, then staging a formal bull-versus-bear debate before synthesizing a single neutral research view (Bullish, Cautious Bullish, Neutral, Cautious, or Bearish — never a buy or sell instruction).
Every factual claim, including each cash flow figure, is traceable back to the underlying filing with an as-of date, so you can check it against the source rather than trust the phrasing. Each report also carries two 0–100 scores — a confidence score reflecting data quality (not a price prediction) and an agreement score showing how much the analysts converged — plus a quality gate before anything reaches you. You can see how a finished cash flow analysis reads inside a full sample research report, or point it at a name yourself from a company research page. If you'd rather learn the underlying concepts one at a time, the Valarn glossary defines each term as it comes up.
The bottom line#
Free cash flow strips a business down to a hard question: after paying for everything it needs to run and grow, how much real cash is left? That's why it's harder to fake than profit and more useful than a headline earnings number — it's the money that actually funds dividends, buybacks, and debt repayment.
Read it alongside net income, not instead of it. Watch whether profit converts into cash year after year, scale it against revenue with FCF margin, and when free cash flow turns negative, don't panic or celebrate — ask why, because heavy investment and genuine trouble can wear the same number. Do that consistently, and free cash flow stops being jargon and becomes one of the clearest windows you have into how a company really works.
Want to see it applied? Explore a full sample report or run your own free research analysis and check the cash flow section against the filings yourself.
Valarn is an educational research tool, not investment advice. It does not tell you to buy, sell, or hold anything, and nothing here is a recommendation or a promise of results. Always do your own research and consider consulting a licensed financial professional.
Valarn
Research
Valarn Research Team

Try Valarn for free
Run AI-powered analysis on any stock — typically 5–20 minutes per report.