
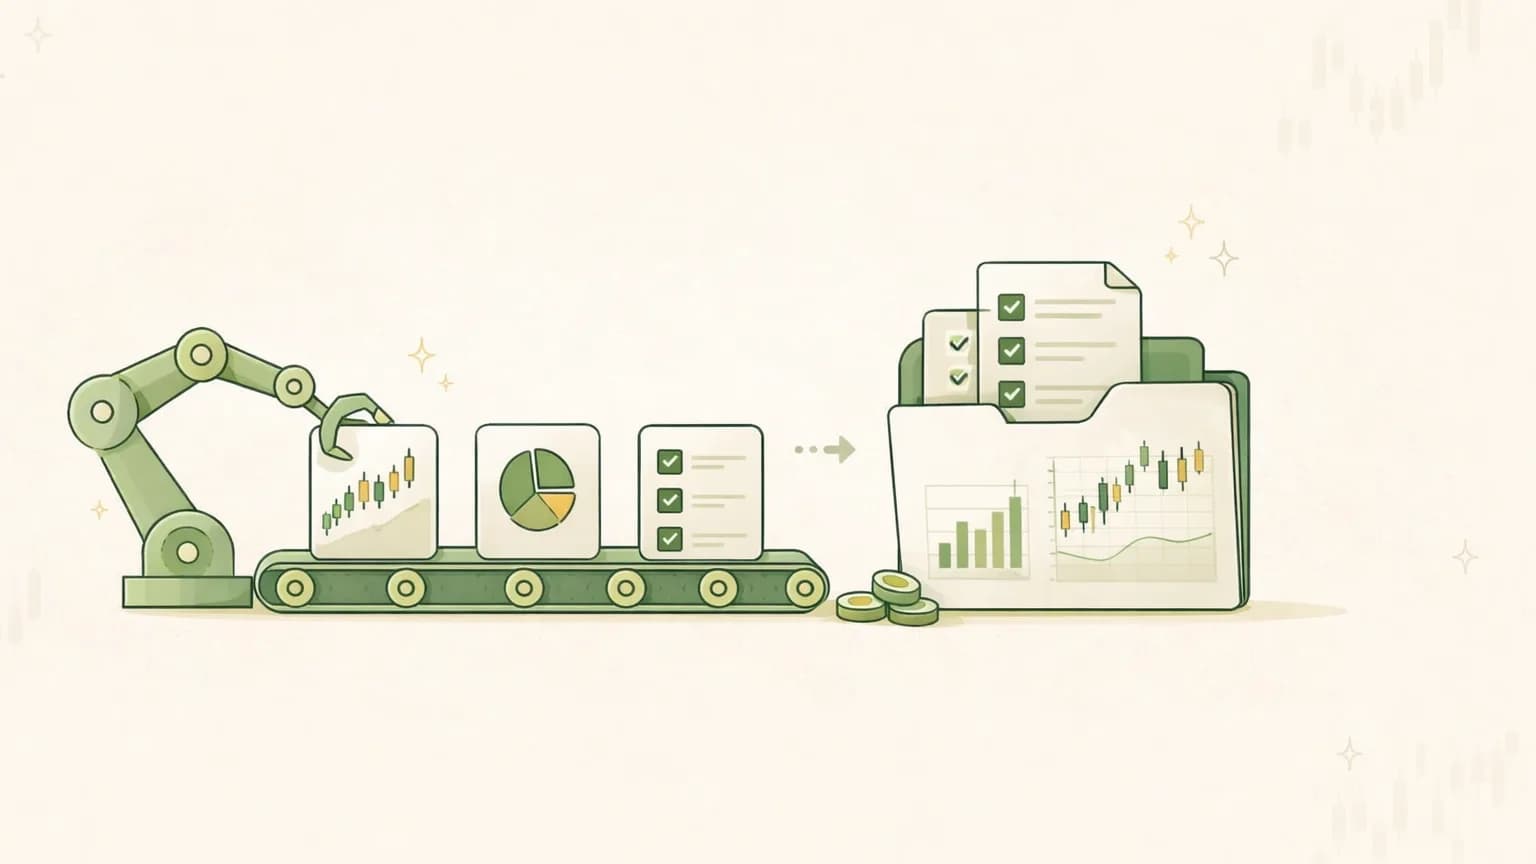
AI can generate a stock report in thirty seconds. What it usually can't do — on its own, from a single prompt — is run the whole AI stock research workflow: the ordered sequence of steps that turns a ticker into a view you can actually defend. Most people ask a chatbot one question, get one fluent paragraph, and mistake that for research.
Research isn't a single answer. It's a pipeline. You screen, you gather primary documents, you analyze the business from several independent angles, you argue both sides, you synthesize a view, and you track how confident you're entitled to be — then you do it again when the facts change. Skip a stage and you get a confident guess wearing a lab coat.
This guide lays out that end-to-end workflow and shows exactly where AI earns its keep at each stage and where you still have to steer. The goal isn't to hand you a verdict. It's to give you a repeatable process you can run on any company, with or without a tool doing the heavy lifting.
The workflow in one picture#
A complete AI stock research workflow moves through seven stages, roughly in order:
- Screen and discover — narrow the universe to names worth the time.
- Gather — pull the filings and data the analysis will rest on.
- Analyze — run separate fundamental, valuation, technical, sentiment, and catalyst passes.
- Debate — argue the bull case against the bear case.
- Synthesize — collapse the disagreement into a single, honest research view.
- Track — record sources, dates, and how confident the picture is.
- Re-analyze — refresh when a catalyst changes the facts.
Each stage feeds the next. The reason to keep them distinct is that they fail in different ways, and separating them is what lets you catch a bad number before it poisons a conclusion. Let's walk through them.
Stage 1 — Screen and discover#
You can't research everything, so the first job is subtraction. Screening narrows thousands of tickers to a shortlist using rules you set: a sector, a size range, a growth threshold, a valuation band, a profitability floor. This is where a lot of people confuse two different tools. A screener filters; a research platform investigates. If you're fuzzy on the distinction, we pulled it apart in AI stock screener vs. AI stock research platform — the short version is that a screen hands you a list of candidates, not conclusions.
AI helps here mostly by translating a plain-English idea ("profitable mid-cap software with slowing debt") into structured filters, and by surfacing names you wouldn't have thought to look at. What it should not do is decide the list is "good." A screen is a starting line. Every name it returns still owes you the next six stages before it means anything. When you've got a ticker in hand, a company research page is a fast way to orient yourself before you commit real time to it.
Stage 2 — Gather the raw material#
Analysis is only as trustworthy as the documents underneath it. This stage is unglamorous and non-negotiable: pull the primary sources before you form any opinion.
That means the 10-K (annual report) and 10-Q (quarterly report) for the financials, 8-K filings for material events, Form 4 filings for insider transactions, and current market data with a date attached. These are the antidote to hallucination, because a claim grounded in a filing can be checked against the document, while a claim floating free of one can't.
This is also the stage where general chatbots quietly break. Asked about a company, a model with no live retrieval will often reconstruct plausible-looking numbers from stale training data and present them with total confidence. So the rule for AI here is simple: grounding beats fluency. If the tool can't tell you what date a figure is as of and which filing it came from, treat the number as unverified no matter how clean it looks. A good workflow stamps an as-of date on everything.
Stage 3 — Run the specialist analyses#
Here's the stage most single-prompt AI use gets wrong. It tries to answer the whole company in one pass. A real workflow runs several independent analyses, each asking a narrow question, because the skills don't overlap — the person reading a cash-flow statement is doing different work than the person reading a price chart. Break it into lanes.
Fundamentals and financial quality#
Start with the business itself: how it makes money, whether revenue is growing and how (more customers, higher prices, or one blockbuster), and whether the margins are stable or eroding. Then check quality — does reported profit actually turn into cash? Earnings are an opinion; free cash flow (operating cash flow minus capital expenditures) is closer to a fact. This lane also runs descriptive scoring screens like the Altman Z-Score (a bankruptcy-risk screen) or the Piotroski F-Score (a nine-point financial-strength checklist). Treat those as descriptive summaries of the current financials, not predictions — a low or high score is a flag to investigate, never a forecast.
Valuation#
Valuation asks one question: what are you being asked to pay for this stream of cash? Multiples like P/E, EV/EBITDA, and free-cash-flow yield only mean something in comparison — versus the company's own history and versus peers. A quick illustrative example of one: free-cash-flow yield is free cash flow divided by market cap, so $2B of free cash flow against a $40B market cap is a 5% yield ($2B ÷ $40B = 0.05). That's a labeled example, not a claim about any real company — but it shows why "expensive" and "cheap" are always relative to something.
Technical and sentiment#
The technical lane describes crowd behavior and timing — the trend, where the price sits in its range — and should stay in that lane; a chart doesn't validate a business. The sentiment lane reads the mood: is the crowd euphoric, fearful, or indifferent, and has news shifted the story? Both are context, not verdicts.
Catalysts and ownership#
Finally, map what's coming — earnings dates, product launches, regulatory decisions, contract renewals — because catalysts are when a story gets re-priced. (New to the idea? See what is a stock catalyst.) And note who owns the stock: cluster insider buying with executives' own money reads differently than routine scheduled selling. These are third-party facts to weigh, not instructions aimed at you.
The reason to keep these lanes separate is the same reason a hospital has specialists: a generalist glancing at everything misses what a focused expert catches. That structure — many narrow agents instead of one broad pass — is exactly how AI agents analyze stocks when the system is built seriously.
Stage 4 — Stage the bull-vs-bear debate#
Independent analyses will disagree, and that's the point. The fundamentals lane might love the balance sheet while the valuation lane thinks the price already reflects it. A workflow that hides this disagreement is lying to you by omission.
So the next stage forces the argument into the open: build the strongest bull case and the strongest bear case, then let them collide. What would have to be true for this to work out — and what specific developments (a margin collapse, a lost anchor customer, a debt wall, a failed launch) would prove the thesis wrong? If you can't state the bear case as convincingly as the bull case, you don't understand the company well enough yet.
This adversarial step is also one of the best defenses against AI overconfidence, because a second agent whose job is to attack the first agent's conclusion catches errors that a single confident pass sails right past. Structuring research as a stress test rather than a sales pitch is the whole idea behind how to research a stock before buying, and it's what keeps a workflow honest.
Stage 5 — Synthesize a research view#
Only after the debate do you collapse everything into a single conclusion. Crucially, that conclusion is a research view, not a marching order. In an educational workflow, the output belongs on a neutral scale — Bullish, Cautious Bullish, Neutral, Cautious, or Bearish — describing how the weight of evidence leans, not telling anyone to buy or sell.
Instead of a single price target (which pretends to a precision nobody has), a good synthesis produces a scenario range — a bear, base, and bull outcome — plus a reference price and a sense of the risk. That's more honest, because the future is a distribution, not a point. The synthesis should read like a verdict with its dissents attached, not a smooth paragraph that buried the disagreement to sound decisive.
Stage 6 — Track confidence and sources#
A conclusion without a confidence level is half a conclusion. Two things worth tracking separately:
- Data quality — how fresh, complete, and consistent were the inputs? Thin or stale data should make the whole picture less sure, and the workflow should say so out loud rather than sounding equally emphatic about everything.
- Agreement — how much did the independent analyses actually converge? Five lanes reaching the same place is a different signal than five lanes split three-to-two, even if the headline view is identical.
Keeping these distinct from the view itself matters, because a "Bullish" read built on stale data and split analysts deserves far less weight than a "Bullish" read built on current filings and broad agreement. And every material claim should stay traceable to its source with a date, so the whole thing is auditable after the fact — the difference between a smooth answer and a checkable one.
Stage 7 — Re-analyze on catalysts#
Research goes stale. A conclusion from last quarter may not survive the last earnings call. The final stage isn't an endpoint — it's a trigger to loop back to Stage 2 when something material changes: an earnings report, a big acquisition, a guidance cut, a management shake-up, a major price move. Re-run the same steps on the new facts. Consistency across runs is what turns individual reports into a comparable body of work instead of a pile of one-off opinions.
Where AI fits — and where you still steer#
AI compresses the slow parts of this workflow dramatically, but it doesn't remove your judgment from any stage. A rough map:
| Stage | What AI does well | Where you steer |
|---|---|---|
| Screen | Turn ideas into filters, surface names fast | Define what "worth researching" means |
| Gather | Pull and date filings and data at scale | Insist on primary sources, reject stale numbers |
| Analyze | Run many focused passes in parallel | Sanity-check against reality and context |
| Debate | Generate a genuine opposing case | Decide which side is more convincing |
| Synthesize | Weigh evidence into a neutral view | Own the decision; it's your money |
| Track | Attach sources, dates, confidence | Judge whether the confidence is earned |
The pattern across the whole table: AI is a tireless research assistant that gathers, structures, and argues — and you remain the decision-maker who sets the questions and grades the output.
How Valarn runs the whole workflow#
This is the pipeline Valarn was built to run as an educational research tool, end to end. Instead of one model handing you a paragraph, it convenes up to about 25 specialist AI analysts across five categories — Core Research, Market Structure, Debate & Risk, Financial Quality, and Events/Sector & Macro — covering fundamentals, valuation, cash flow, ownership, sentiment, technical, catalyst, sector, and macro, each owning one lane of Stage 3.
Those analysts then run Stage 4 as a structured bull-versus-bear debate, which synthesizes into a single neutral research view (Bullish through Bearish — never a buy/sell order). Every factual claim stays traceable to a filing or licensed data source with an as-of date, and a QA gate checks the report before it reaches you. Two separate 0-100 scores handle Stage 6: a confidence score that reflects data quality (not a price prediction) and an agreement score for how much the analysts converged. And instead of a false-precision price target, you get a scenario range — bear, base, and bull — with a reference price and risk level. You can see how the pieces connect on the features overview or read why we built it this way.
The honest framing: none of this promises to be right. It's built to be checkable — every stage inspectable, every number sourced, every disagreement visible. That's the whole point of running a workflow instead of trusting a vibe.
Want to see the finished pipeline on a real company? Walk through a complete sample research report, or run your own free analysis and watch all seven stages get covered in a few minutes.
The bottom line#
A good AI stock research workflow isn't one clever prompt — it's a discipline: screen, gather, analyze from independent angles, argue both sides, synthesize a neutral view, track your confidence, and re-run when the facts move. AI can carry the heavy, repetitive load at every stage, but it works for your judgment, not instead of it. Run the same stages every time and your research becomes something you can inspect and compare, rather than a story you happened to find convincing.
The measure of a workflow isn't how confident the answer sounds. It's how much of it you can check.
Valarn is an educational research tool, not investment advice. It does not tell you to buy, sell, or hold anything, and nothing here is a recommendation or a promise of results. Always do your own research and consider consulting a licensed financial professional.
Valarn
AI Research
Valarn Research Team

Try Valarn for free
Run AI-powered analysis on any stock — typically 5–20 minutes per report.