
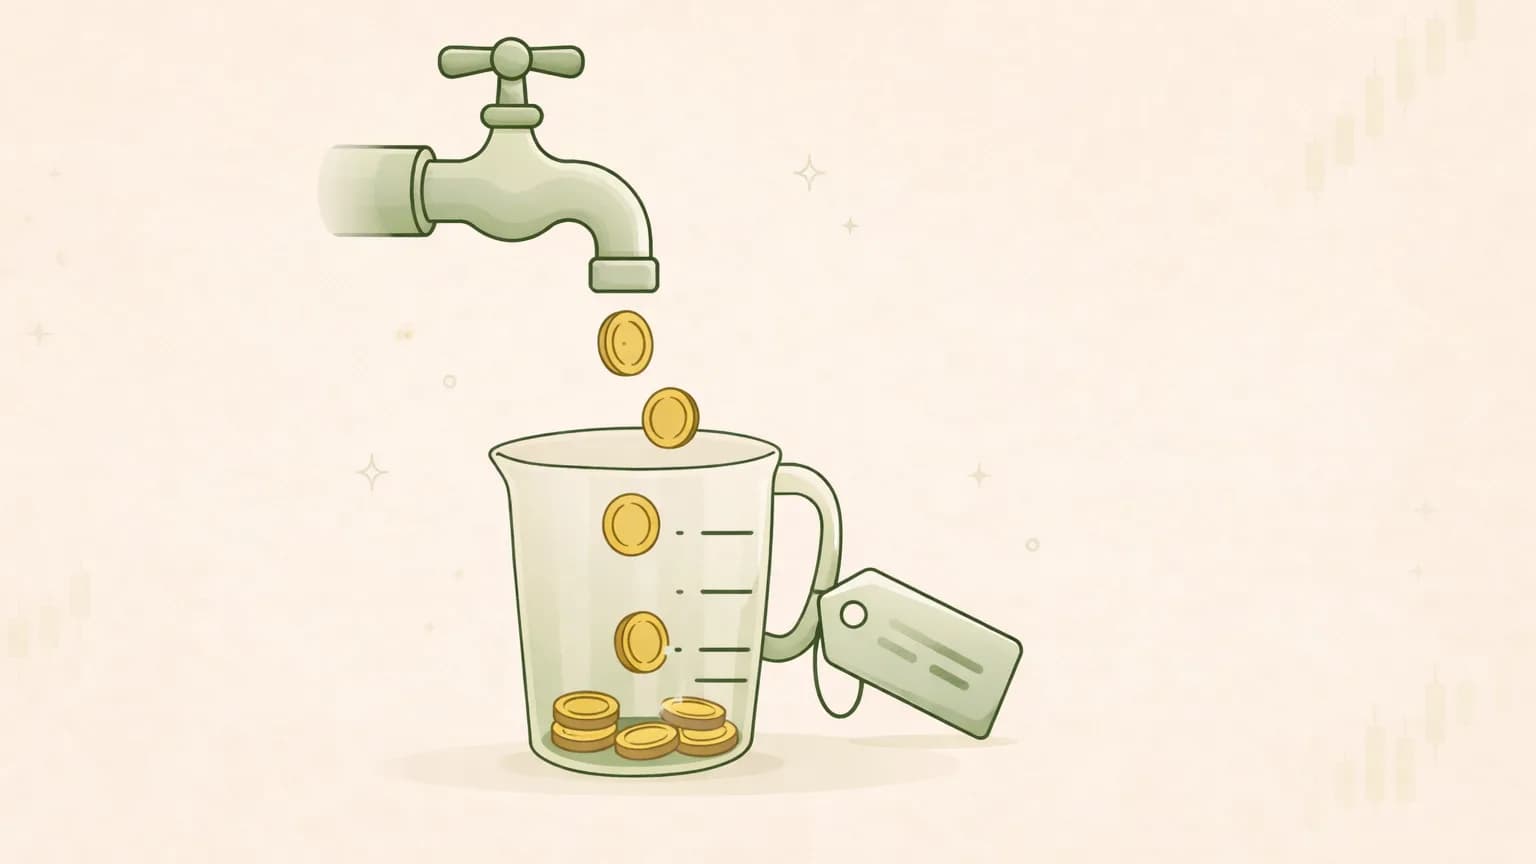
Free cash flow is the money a business actually has left over after it pays to keep the lights on and invest in its own future. Free cash flow yield takes that number one step further and asks the question every buyer should ask: for the price I'd pay today, how much cash is this business actually throwing off?
That framing is the whole appeal. A price on its own tells you nothing — $200 a share is cheap for one company and absurd for another. But when you express free cash flow as a percentage of what you'd pay to own the company, you get a clean, comparable number that behaves a lot like the yield on a bond. It's one of the most honest valuation lenses there is, precisely because cash is harder to fake than earnings.
This guide walks through what free cash flow yield measures, the exact formula (with math that adds up), why it often beats the P/E ratio, and the traps that make a "high" yield misleading. None of it is a signal to buy or sell anything — it's a way to understand what you're being asked to pay for.
What free cash flow yield actually measures#
Start with the plain-English version. If a company generates a certain amount of free cash flow each year, and you could buy the entire company today at its market price, the free cash flow yield is the annual cash return that purchase would throw off — expressed as a percentage of the price.
A 5% free cash flow yield means the business produces cash equal to 5% of its price every year. A 2% yield means the same business would have to double or triple its cash generation to give you the same return at today's price. Higher yield, more cash per dollar paid; lower yield, less.
It's essentially the inverse of the price-to-free-cash-flow ratio. Where P/FCF tells you how many years of cash flow you're paying for, free cash flow yield flips it into a return figure. A 20x price-to-free-cash-flow multiple is the same thing as a 5% yield — one divided by twenty. Some people find "20 years of cash flow" more intuitive; others prefer "5% cash return." They're two views of one relationship, and it's worth being fluent in both.
The reason this matters is that it puts a stock on the same footing as everything else you could do with your money. A bond quotes a yield. A savings account quotes a yield. Expressing a stock's cash generation as a yield lets you reason about it in the same units — as long as you remember that a company's cash flow can grow, shrink, or vanish in a way a fixed bond coupon can't.
The formula, with an example that adds up#
There are two versions, and the difference matters.
The market-cap version:
Free cash flow yield = Free cash flow ÷ Market capitalization
The enterprise-value version:
Free cash flow yield = Free cash flow ÷ Enterprise value
Free cash flow itself is operating cash flow minus capital expenditures — the cash from running the business, less what the company had to reinvest in property, plant, and equipment. If that definition is fuzzy, our companion piece on free cash flow breaks down each component and the ways the number gets massaged.
Let's put numbers to it. Say a company generates $2 billion in free cash flow and trades at a $40 billion market cap:
- Free cash flow yield = $2B ÷ $40B = 5%
Flip it and you get the price-to-free-cash-flow multiple: $40B ÷ $2B = 20x. As promised, 5% and 20x are the same fact wearing different clothes.
Now add the balance sheet. Suppose that same company also carries $10 billion in net debt (total debt minus cash). Its enterprise value — what it would really cost to buy the whole business, debts and all — is $40B + $10B = $50 billion. The enterprise-value yield is:
- Free cash flow yield (on EV) = $2B ÷ $50B = 4%
Same cash, lower yield, because you're honestly accounting for the debt you'd be taking on. That gap between 5% and 4% is the story the market-cap version quietly hides.
Market-cap yield vs enterprise-value yield#
Which one should you use? It depends on what you're trying to see.
The market-cap version answers the equity holder's question: for the price of the shares, how much cash does the business produce? It's simpler and fine for comparing companies with similar debt loads.
The enterprise-value version is usually the cleaner lens when capital structures differ. Because it puts debt-heavy and debt-light companies on the same basis, it stops a business from looking cheap purely because it's loaded with borrowing. If you're comparing a company with a fortress balance sheet against a leveraged rival, the enterprise-value yield is the fairer fight. Many analysts default to it for exactly that reason.
The one rule that matters more than the choice: be consistent. Compare EV yields to EV yields and market-cap yields to market-cap yields. Mixing them produces conclusions that look rigorous and mean nothing.
Why it's often a cleaner lens than P/E#
The price-to-earnings ratio is the most quoted valuation metric on earth, and it has a structural weakness: earnings are an accounting opinion. Net income runs through depreciation schedules, non-cash charges, one-time "adjustments," and revenue-recognition choices — all legitimate, all subject to judgment, and all things that can make profit look better or worse than the cash reality underneath.
Free cash flow yield sidesteps a lot of that because it's built on cash that actually moved. Here's how the two stack up.
| P/E ratio | Free cash flow yield | |
|---|---|---|
| Built on | Net income (accounting profit) | Cash actually generated |
| Includes capex? | No — capital spending is spread out as depreciation | Yes — subtracts real reinvestment |
| Easy to massage? | More exposed to non-cash accounting choices | Harder, though not immune |
| Reads as | A multiple ("25x earnings") | A yield ("4% cash return") |
| Comparable to bonds? | Not directly | Yes, in yield terms |
The capex point is the big one. Two companies can report identical earnings, but if one has to pour cash into factories and equipment just to stand still while the other runs asset-light, their free cash flow — and therefore their yield — will look very different. P/E can't see that gap; free cash flow yield puts it front and center. Earnings tell you what a company reported; cash flow tells you what it kept.
None of this makes P/E useless — it's still a fast, widely understood gauge, and for some business models it's more stable than lumpy cash flow. The point is that free cash flow yield asks a harder, more grounded question, which is why it's a valuable second opinion when you're trying to figure out whether a stock is overvalued or undervalued.
What counts as a "good" yield — context, not a threshold#
Here's where people go wrong: they hear "5% yield" and reach for a rule like "above 5% is cheap." There is no such universal line, and anyone selling you one is oversimplifying. A yield only means something in context. Three comparisons give it meaning.
- Versus what cash pays elsewhere. A stock's free cash flow yield lives in the same world as bond yields and cash rates. When risk-free assets pay very little, a modest equity cash yield looks more attractive; when they pay a lot, the bar for a stock rises. The comparison isn't a formula, it's a sense of what you're being compensated for taking on business risk.
- Versus the company's own history. Is today's yield high or low relative to where this specific stock has traded over the past five or ten years? A business yielding 6% when it usually yields 3% is being priced differently than it used to be — and that's worth understanding, whether the reason is fear, a genuine change in the business, or the market catching a problem you haven't spotted yet.
- Versus close peers. Two companies in the same industry with similar economics should trade at broadly similar yields. A wide gap is a question, not an answer: is the higher-yielding one genuinely cheaper, or is the market pricing in a risk the number doesn't show?
And crucially, a low yield isn't automatically bad. A fast-growing company that will generate far more cash in five years deserves a lower starting yield today, the same way you'd pay up for a stream of income that's about to expand. A high yield on a business in structural decline can be a warning, not a bargain. The yield is the starting question, not the verdict — which is exactly the mindset behind our broader 12-step research checklist.
The traps that make a high yield lie#
A yield is only as trustworthy as the free cash flow number underneath it. Because that number can be temporarily inflated, a "cheap" yield sometimes evaporates the moment you look closely. Watch for these.
- Capex starvation. Free cash flow rises instantly if a company simply stops investing — cutting the "minus capital expenditures" part of the equation. That's not efficiency; it's borrowing from the future. A yield that looks great because maintenance spending was slashed is a mirage. Check whether reinvestment is sustainable or suspiciously low.
- One-time working-capital swings. A company can generate a burst of cash in a single year by squeezing inventory or stretching payments to suppliers. It flatters that year's free cash flow and won't repeat. Look at several years, not one, so a temporary swing doesn't masquerade as a permanent yield.
- Stock-based compensation. Free cash flow often adds back non-cash stock compensation, which can overstate the cash truly available to owners when heavy share issuance is quietly diluting them. It's a real cost even when it doesn't move cash — factor it in.
- Cyclical peak earnings. For a cyclical business — commodities, semiconductors, autos — free cash flow at the top of the cycle is as good as it gets. A juicy yield calculated on peak cash flow can be the definition of a value trap: cheap-looking right before the cycle turns and the cash flow falls off a cliff.
- Debt-funded distributions. A company can prop up the appearance of cash generation while its balance sheet quietly deteriorates. Always sanity-check the yield against the trend in net debt.
The common thread: a single year's free cash flow yield is a snapshot, and snapshots lie about businesses that are lumpy, cyclical, or under-investing. Trends and context are what turn the number into understanding.
Where free cash flow yield fits in a real research process#
Free cash flow yield is one lens, and no single lens should carry a decision. It tells you what you're paying for the cash a business produces — but it can't tell you whether that cash is durable, whether the moat protecting it is real, or whether the capex line is being managed honestly. Those questions live in the filings, the competitive picture, and the cash-flow statement's fine print.
That's the gap Valarn is built to close, as an educational research tool. Instead of one confident paragraph, it runs up to about 25 specialist AI analysts across five categories — core research, market structure, a debate-and-risk committee, financial quality, and events/sector/macro — so the analyst asking about valuation is checked by others examining cash-flow quality, capital spending, and balance-sheet health. They stage a structured bull-versus-bear debate, then synthesize a single neutral research view (Bullish, Cautious Bullish, Neutral, Cautious, or Bearish — never a buy or sell instruction). Every factual claim traces back to a filing or licensed data source with an as-of date, passes a quality-assurance gate, and comes with two 0-100 scores: a confidence score reflecting data quality (not a price prediction) and an agreement score showing how much the analysts converged. Instead of a single price target, you get a Scenario Range — bear, base, and bull — with a Reference Price and a Risk Level.
If you want to see how a valuation figure like free cash flow yield sits inside a full report, skim a complete sample analysis, read up on the mechanics in the Valarn glossary, or start with any ticker on a company research page.
The bottom line#
Free cash flow yield reframes valuation around the one thing that's hardest to fake: the cash a business actually generates, measured against what you'd pay to own it. It's a cleaner lens than P/E because it's grounded in cash rather than accounting profit, it puts a stock in the same yield-based language as the rest of your options, and it forces you to reckon with capital spending instead of ignoring it.
But it's a starting question, not an answer. A high yield can be a genuine bargain or a starved, cyclical, or diluting business dressed up to look like one — and only context, trends, and the story underneath the number tell you which. Use it to sharpen the question "what am I paying for this cash?", then do the work to find out whether that cash is real and lasting. Run a free sample research report and watch how a full research desk pressure-tests exactly that.
Valarn is an educational research tool, not investment advice. It does not tell you to buy, sell, or hold anything, and nothing here is a recommendation or a promise of results. Always do your own research and consider consulting a licensed financial professional.
Valarn
Research
Valarn Research Team

Try Valarn for free
Run AI-powered analysis on any stock — typically 5–20 minutes per report.