
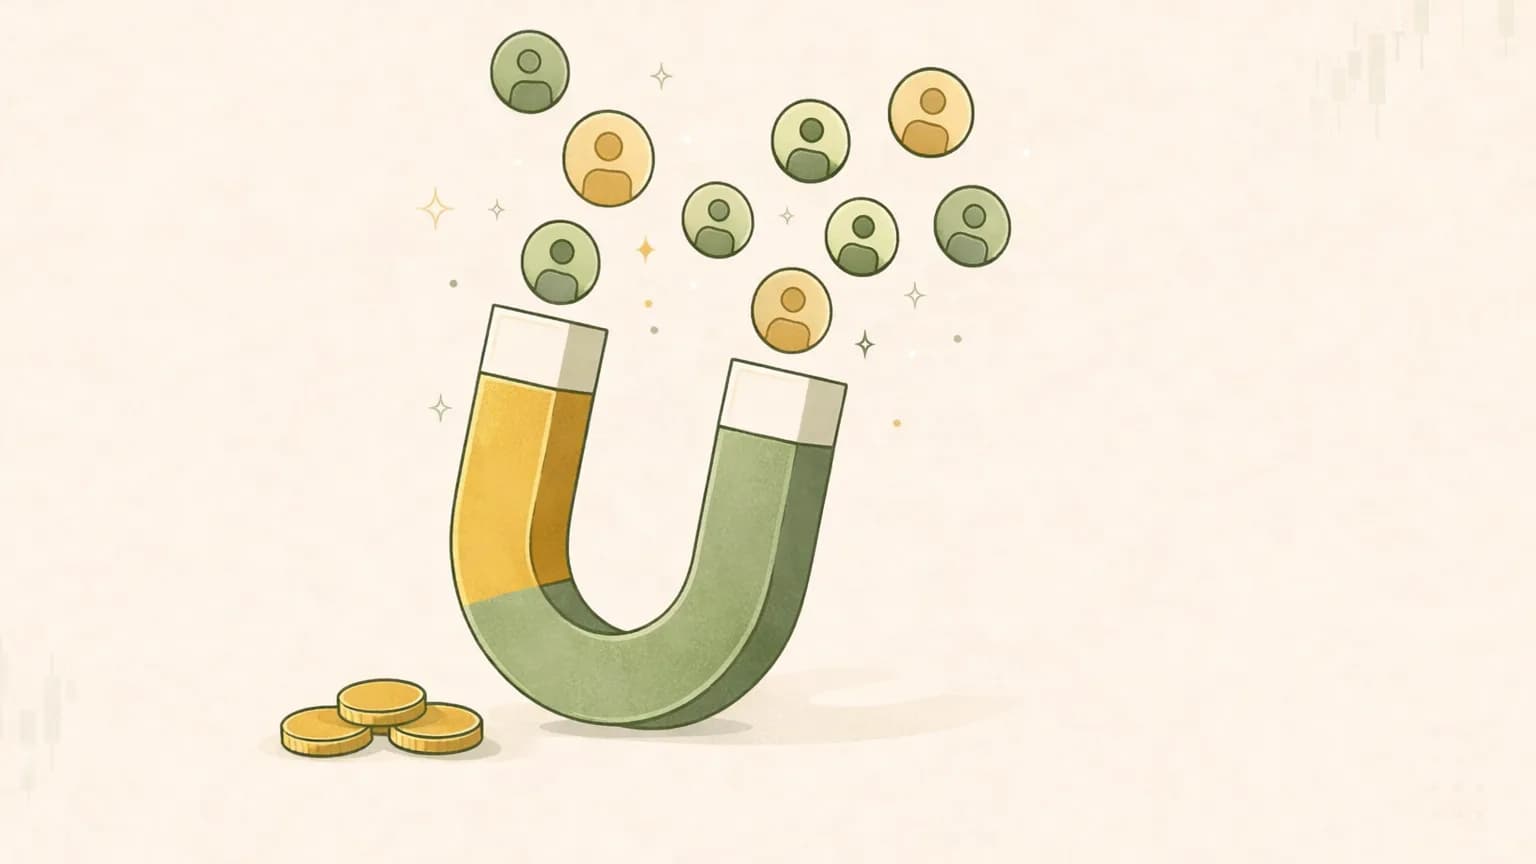
Customer acquisition cost is one of those numbers that quietly decides whether a growth story is real or just expensive. A company can post dazzling revenue growth and still be getting weaker every quarter — if each new customer costs more to win than they'll ever be worth.
That's the whole reason to care about customer acquisition cost, usually shortened to CAC. It answers a deceptively simple question: how much does this business spend to land one new customer? Once you can answer that, a lot of hand-wavy "hypergrowth" narratives suddenly become checkable — because growth you have to buy at a loss isn't the same thing as growth that pays for itself.
This guide walks through what CAC is, how to calculate it, the two versions you'll run into (blended and paid), why the number is nearly useless on its own, and what a rising CAC is quietly telling you. No jargon left undefined, and every example number is labeled and worked out so you can follow the arithmetic yourself.
What customer acquisition cost actually measures#
The core formula is refreshingly plain:
CAC = total sales & marketing spend ÷ number of new customers acquired (over the same period)
That's it. Add up what a company spent on sales and marketing in a quarter or year — ad budgets, sales-team salaries and commissions, marketing tools, the whole go-to-market machine — and divide by the number of new customers those efforts brought in.
A worked example: suppose a software company spends $9 million on sales and marketing in a quarter and, over that same quarter, adds 3,000 net new customers. Its CAC is:
$9,000,000 ÷ 3,000 = $3,000 per customer
So it costs this business roughly $3,000 to acquire one customer. Whether that's cheap or ruinous depends entirely on what a customer is worth — which is the whole point of the sections below. Right now, just anchor on the mechanic: spend divided by customers won.
A few things worth getting right up front:
- Use the right spend. True CAC includes the fully loaded cost of acquisition — not just ad dollars but the salaries, commissions, and tooling that go into winning customers. Many quick estimates only capture paid media and understate the real number.
- Match the time windows carefully. Marketing you spend today often converts customers over the next several months. Dividing this quarter's spend by this quarter's signups can distort the number in a business with a long sales cycle.
- Decide whose customers. For a subscription business, "new customers" usually means net new (new signups minus churned accounts) or gross new (all signups). They tell different stories, so know which one you're looking at.
Note that CAC isn't a number companies are required to report. It doesn't appear on the income statement the way revenue or gross margin does. Analysts estimate it from disclosed sales-and-marketing spend and customer counts — which makes it powerful but also easy to compute inconsistently. More on that caveat later.
Why CAC matters — to the company and to you#
For the company, CAC is one leg of its unit economics: the profit-and-loss math of a single customer, stripped away from the noise of the overall business. A company with attractive unit economics can pour money into growth and come out ahead. A company with broken unit economics gets worse the faster it grows, because every new customer digs the hole deeper.
For you as someone researching the stock, CAC is a lie-detector for growth. Revenue growth on its own tells you nothing about quality — a business can buy revenue by spending recklessly to acquire customers who never become profitable. CAC, paired with what a customer is worth, tells you whether that growth is creating value or consuming it.
This is exactly why unit economics sit near the center of any serious look at a subscription business. If you're digging into software specifically, our guide on how to analyze SaaS stocks puts CAC alongside the other metrics that actually move the needle. And if you want the plain-English definitions of the supporting terms as you go, keep the Valarn glossary open in another tab.
Blended CAC vs paid CAC#
Here's where CAC gets slippery, and where you'll catch companies flattering their own numbers. There are two common versions, and they can differ a lot.
- Blended CAC takes all sales-and-marketing spend and divides by all new customers — including the ones who showed up organically through word of mouth, referrals, or search. Because "free" organic customers are folded into the denominator, blended CAC looks lower.
- Paid CAC isolates just the spend on paid channels (ads, paid sales outreach) and divides by only the customers those paid channels produced. It answers a sharper question: what does it cost to acquire the next customer you have to go out and buy?
Watch how much these can diverge. Take the same company from before — $9M spend, 3,000 new customers, blended CAC of $3,000. Now suppose 1,200 of those customers arrived organically at little marginal cost, and the remaining 1,800 came from paid channels that consumed $7.2M of measurable ad and sales spend:
Paid CAC = $7,200,000 ÷ 1,800 = $4,000 per customer
| Metric | Spend used | Customers counted | Result |
|---|---|---|---|
| Blended CAC | All $9.0M S&M | All 3,000 | $3,000 |
| Paid CAC | $7.2M paid channels | 1,800 paid | $4,000 |
Same company, same quarter, but paid CAC is a third higher than blended. Neither number is "wrong" — they answer different questions. Blended CAC tells you the average cost across the whole go-to-market; paid CAC tells you the marginal cost of scaling.
Why it matters for research: a company that leans on strong organic demand (a beloved brand, genuine word of mouth) can show a low blended CAC that's genuinely healthy. But if a business is quietly becoming more dependent on paid channels to keep growth up, its blended CAC can look stable while its paid CAC climbs underneath. When a company only discloses the flattering version, that's a signal to dig, not to relax.
CAC means almost nothing on its own#
Is a $3,000 CAC good or bad? You genuinely cannot say — not without knowing two other things: how much a customer is worth, and how long it takes to earn the acquisition cost back. CAC is one number in a trio, and read in isolation it's just as likely to mislead you as inform you.
Pair it with lifetime value: the LTV/CAC ratio#
Lifetime value (LTV) estimates the total gross profit a company expects to earn from a customer over the whole relationship. The cleanest comparison uses gross-profit LTV — revenue from the customer minus the cost of serving them — because that's the money actually available to cover the acquisition cost and then some.
Continuing the example: say each customer pays $200 per month, the company keeps 75% as gross margin (so $150 of monthly gross profit), and the average customer stays 60 months (five years). Then:
Gross-profit LTV = $150 × 60 = $9,000
LTV ÷ CAC = $9,000 ÷ $3,000 = 3.0
An LTV/CAC of 3.0 is the number you'll see cited as a rough rule of thumb for a healthy subscription business — roughly three dollars of lifetime gross profit for every dollar spent to acquire the customer. Below ~1.0 and the company is destroying value with every sale; very high ratios can even hint a business is under-investing in growth. But treat these as descriptive guideposts, not laws of nature — the "right" ratio varies by industry, margin structure, and how the inputs are estimated. We break the whole ratio down, including how the benchmark can be gamed, in the LTV/CAC ratio explained.
Pair it with time: the CAC payback period#
The ratio above ignores timing, and timing is where cash-flow risk lives. A business can have a beautiful LTV/CAC on paper and still strangle itself on cash if it takes years to recoup each customer.
The CAC payback period measures how long it takes to earn back the acquisition cost from a customer's gross profit:
Payback = CAC ÷ monthly gross profit per customer = $3,000 ÷ $150 = 20 months
So it takes about 20 months of payments before this customer stops being a net cost. Shorter paybacks mean a business recycles its cash faster and needs less funding to grow; longer paybacks mean growth is hungrier for capital and more exposed if customers churn early — because a customer who leaves before payback never becomes profitable at all. We go deeper on the trade-offs, including what counts as "fast," in the CAC payback period explained.
Put the three together and you have a real picture: CAC (what it costs), LTV/CAC (whether it's worth it), and payback (how long your money's tied up). Any one alone can flatter or frighten you; together they're hard to fake.
When rising CAC is a warning sign#
A single CAC figure is a snapshot. The trend is often the more useful signal, because CAC rarely moves without a reason.
Watch for CAC creeping up while LTV stays flat. That's unit economics quietly deteriorating: the company is paying more to win customers who aren't worth any more than they used to be. If it continues, the LTV/CAC ratio compresses and the payback period stretches — the growth is getting more expensive to sustain.
Common reasons CAC rises, and what each might be telling you:
- Channel saturation. A company has already reached the easy-to-convert audience and now has to pay more to reach the next, less-interested customer. Growth by paying up for marginal demand tends to show up here first.
- Intensifying competition. More rivals bidding for the same ad keywords and the same buyers pushes acquisition costs up across the board.
- Declining product-market fit. If the product is resonating less, marketing has to work harder (and spend more) for each conversion.
- A shift from organic to paid. As covered above, blended CAC can look calm while the business grows quietly more dependent on paid acquisition — a fragile foundation if ad costs rise.
None of these is automatically fatal; a company might raise CAC deliberately to grab share in a land-grab market, betting on high retention to pay it back. The research question is always the same: is the rising cost buying customers who are worth it? That's why CAC is worth tracking next to retention and net revenue retention — falling retention plus rising CAC is a genuinely worrying combination, while rising CAC paired with rock-solid retention is a very different story.
And keep the honest caveat in view: CAC and its cousins are descriptive measures of a business's economics, not predictions of the stock's future. They help you understand how a company grows and how durable that growth looks — they don't forecast a price. Treat them as evidence to weigh, not a verdict.
The catch: you usually have to estimate CAC#
Because CAC isn't a mandated line item, comparing it across companies is trickier than it looks. Two analysts can compute different CACs for the same business depending on:
- Which spend they include (all of sales and marketing, or just measurable ad spend).
- How they count customers (gross new vs net new, and how they handle churn).
- How they handle timing lag between spend and conversion.
- Whether they use blended or paid figures.
So when you see a CAC number in a headline or an analyst note, ask how it was built before you compare it to anything. A like-for-like comparison against a peer requires the same recipe on both sides — otherwise you're comparing two different measurements that happen to share a name. When you're orienting on a specific company, a company research page is a fast way to pull the underlying sales-and-marketing spend and customer disclosures you'd need to sanity-check any CAC estimate yourself.
Where CAC fits in a full research process#
CAC is one thread in a much larger fabric. On its own it can mislead; woven together with retention, margins, cash flow, valuation, and the competitive picture, it becomes genuinely informative. The hard part is doing all of that consistently, every time, without letting a good growth story override an inconvenient unit-economics number.
That's the work Valarn was built to run as an educational research tool. Instead of one AI handing you a confident paragraph, it convenes up to about 25 specialist AI analysts across five categories — core research, market structure, debate and risk, financial quality, and events, sector, and macro — each covering one slice of the analysis, from fundamentals and cash flow to sentiment and catalysts. They then stage a structured bull-versus-bear debate and synthesize a single neutral research view (Bullish, Cautious Bullish, Neutral, Cautious, or Bearish — never a buy or sell order).
What makes it checkable rather than just fluent: every factual claim is traceable to a filing or licensed data source with an as-of date, a quality-assurance gate runs before anything reaches you, and each report carries two 0–100 scores — a confidence score (how solid the underlying data is, not a price prediction) and an agreement score (how much the analysts converge). Instead of a single price target, you get a scenario range (bear / base / bull), a reference price, and a risk level. You can see exactly what that looks like in a complete sample research report, or run your own free analysis and inspect the reasoning yourself.
The bottom line#
Customer acquisition cost is the number that tells you whether growth is an asset or a liability. Calculating it is easy — sales-and-marketing spend divided by new customers — but reading it well means never looking at it alone: pair it with lifetime value to see if a customer is worth winning, with the payback period to see how long your cash is tied up, and check whether you're looking at the blended or the paid version before you compare anything. Then watch the trend, because a rising CAC against flat customer value is one of the clearest early warnings that a growth story is getting more expensive than it looks.
Get in the habit of asking that one question — what does it cost to win a customer, and is that customer worth it? — and a lot of impressive-sounding growth stops impressing you and starts explaining itself.
Valarn is an educational research tool, not investment advice. It does not tell you to buy, sell, or hold anything, and nothing here is a recommendation or a promise of results. Always do your own research and consider consulting a licensed financial professional.
Valarn
Research
Valarn Research Team

Try Valarn for free
Run AI-powered analysis on any stock — typically 5–20 minutes per report.