
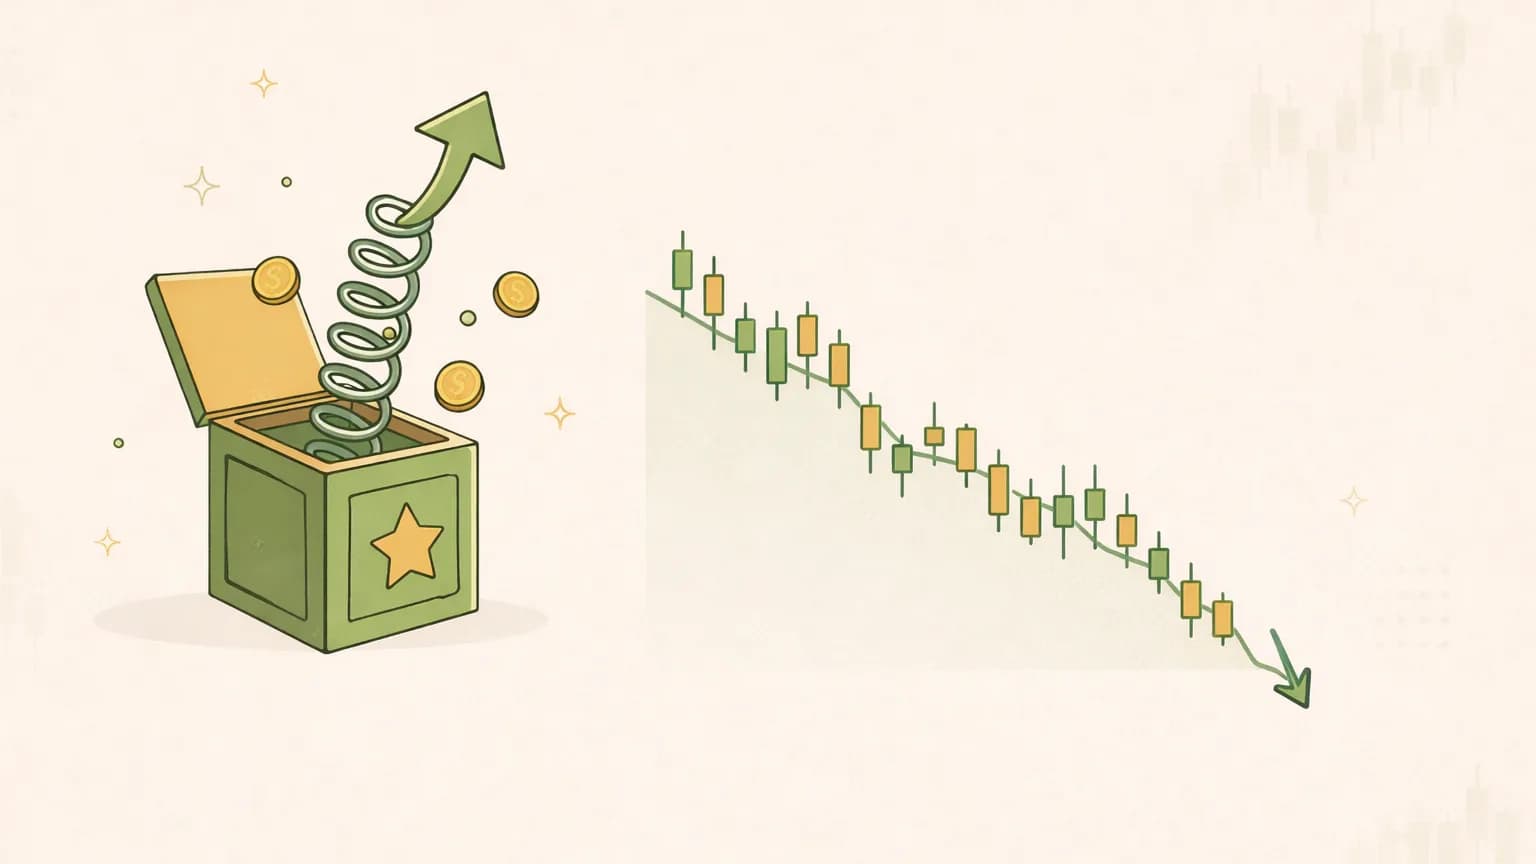
A company reports quarterly earnings, beats every analyst estimate on Wall Street, and the stock drops 9% before lunch. If you've ever watched that happen and assumed the market had lost its mind, you've run straight into the strange logic of the earnings surprise — one of the most misunderstood events in investing.
Here's the thing most people get backwards: the stock doesn't react to how good the numbers were. It reacts to how good they were relative to what everyone already expected. A blowout quarter that the market had fully anticipated can be a non-event, or worse. A mediocre quarter that came in less-bad than feared can rip higher. The number on the page is only half the story; the other half is the invisible bar it had to clear.
This guide explains what an earnings surprise actually is, why a beat can still tank a stock and a miss can rally, and what "post-earnings drift" means for the days after the report. The goal isn't a trading signal — it's to help you read an earnings reaction without being fooled by the headline.
ما هي مفاجأة الأرباح فعلاً#
An earnings surprise is the gap between a company's actual reported result and the consensus estimate — the average of the forecasts published by the analysts who cover the stock. Most often it's quoted on earnings per share (EPS), though revenue and other line items get the same treatment.
The math is straightforward:
- Surprise (dollars) = Actual EPS − Consensus EPS
- Surprise (percent) = (Actual − Consensus) ÷ Consensus
Say the Street expected EPS of $1.50 and the company delivered $1.62. That's a positive surprise of $0.12, or 8% (0.12 ÷ 1.50 = 0.08). Come in at $1.41 instead and you've got a negative surprise — a "miss" — of $0.09, or about 6% below consensus. Those are illustrative numbers, but the arithmetic is exactly how the figure is built.
The consensus itself is just an aggregate of individual analyst models, and it's worth understanding how it's assembled before you lean on it — we unpack that in ما هو تقدير إجماع المحللين. The one-line version: consensus is the market's official expectation, and the surprise measures how far reality landed from it.
لماذا الرقم أقل أهمية مما تعتقد#
Markets are forward-looking pricing machines. By the time a company reports, its stock price already reflects a mountain of expectations — analyst models, management's prior guidance, industry data, and the collective guesswork of everyone positioned in the name. A lot of "good news" is priced in long before the press release hits.
So the reaction on earnings day is really a measurement of surprise in the literal sense: how much new information arrived versus what the crowd had already baked in. This is why two companies can post identical growth rates and see their stocks move in opposite directions. One cleared a low bar; the other tripped over a high one.
Keep that framing in mind, because it explains every counterintuitive move below.
لماذا يمكن أن يؤدي تجاوز التقديرات إلى انخفاض السهم#
A headline "beat" feels like it should be bullish. Often it isn't. Here are the three most common reasons a stock falls after beating estimates — the phenomenon we dig into further in لماذا تنخفض الأسهم بعد الأرباح الجيدة.
تم تسعير الزيادة بالفعل#
The published consensus is the official bar, but it's frequently not the real one. Ahead of a report, an unofficial, higher expectation circulates among traders — the so-called whisper number. If analysts publicly model $1.50 but the market is quietly bracing for $1.70, then a "beat" at $1.62 is actually a miss versus what people expected, and the stock sells off despite topping the official figure.
This gap between the stated estimate and the true expectation is one of the sneakiest traps in earnings analysis. It's worth understanding on its own, which is why we wrote a full explainer on the رقم همسات الأرباح. The practical takeaway: a beat relative to consensus tells you less than you'd hope, because consensus isn't always the bar the stock is trading against.
كانت التوجيهات ضعيفة#
An earnings report has two parts: what already happened (last quarter) and what management says is coming (guidance for the next quarter or the full year). Markets care far more about the future than the past. A company can beat on the quarter it just reported and then guide the next one below expectations — and the stock will follow the guidance down, because that forward number resets the whole thesis.
This is the classic "beat and lower" setup, the ugly cousin of the pattern you want, which is beat and raise — beating the quarter and raising the outlook. When you see a stock fall on a beat, the first place to look is almost always the guidance line. What management signals about the future routinely overrides what it just delivered; our piece on كيف تعمل توجيهات الشركات covers why that forward number carries so much weight.
كانت الزيادة ذات جودة منخفضة#
Not all beats are created equal. A high-quality beat comes from the engine of the business: more units sold, higher prices, expanding margins, real demand. A low-quality beat comes from everywhere else — a lower-than-expected tax rate, a one-time gain, aggressive share buybacks that shrink the share count and flatter per-share earnings, or cost-cutting that can't repeat.
The market usually sees through the low-quality version. If EPS beat only because the company bought back stock or booked a one-off item, while revenue stalled and margins slipped, sophisticated holders read that as a deteriorating business wearing a beat as a costume. The stock can fall even as the headline says "beat." This is exactly why reading the full report — not just the top line — matters, and why we built a step-by-step قائمة مراجعة تقرير الأرباح to separate the two kinds of beat.
لماذا يمكن أن يرتفع السهم بعد الفشل#
The mirror image is just as real. A company can miss consensus and still climb, and the reasons rhyme with the ones above:
- خوف أسوأ. If sentiment was catastrophic going in — the whisper number was ugly, the sector was in freefall, short interest was heavy — a "less bad than feared" miss removes uncertainty. Relief buying does the rest.
- توجيه قوي. A weak quarter paired with a confident, raised outlook tells the market the future is improving, even if the past stumbled. Forward beats backward.
- عبء مؤقت. If the miss traces to a clearly temporary cause — a supply disruption, a delayed shipment that slips into next quarter, a legal charge — investors may look right through it to the underlying trajectory.
None of this means "misses are secretly good." It means the reaction is always actual versus expectation plus guidance, never the raw number in isolation. Once you internalize that, earnings-day moves stop looking random.
انحراف ما بعد إعلان الأرباح#
إليك الجزء الذي يفاجئ الناس أكثر: رد الفعل على مفاجأة الأرباح غالبًا ما لا ينتهي في يوم التقرير. لقد وثق الباحثون ميلًا مستمرًا — تم دراسته منذ أواخر الستينيات ويعرف باسم انحراف ما بعد إعلان الأرباح (PEAD) — لأسهم تستمر في التحرك في نفس الاتجاه مثل مفاجأتها لأسابيع بعد التقرير. كانت المفاجآت الإيجابية الكبيرة تميل تاريخيًا إلى الانحراف للأعلى؛ بينما كانت المفاجآت السلبية الكبيرة تميل إلى الانحراف للأسفل.
التفسير الرائد هو أن الأسواق تتفاعل بشكل غير كافٍ في البداية. لا يستوعب المستثمرون المعلومات الجديدة بالكامل في جلسة واحدة، لذا يتكيف السعر تدريجيًا مع تعديل المحللين لنماذجهم وتفاعل المزيد من حاملي الأسهم. في نظرية السوق الكفء، لا ينبغي أن يحدث هذا، وهو بالضبط السبب في أن PEAD هو واحد من أكثر الشذوذات المدروسة في المالية.
تحذيران صادقان، لأن هذا هو المكان الذي يتعرض فيه الناس للخسارة:
- إنه ميل موثق، وليس ضمانًا. يصف PEAD نمطًا متوسطًا عبر العديد من الأسهم على مدى فترات طويلة. يمكن أن يتصرف أي اسم فردي بشكل عكسي. ليست قاعدة يمكنك التداول بها بشكل ميكانيكي، والأنماط السابقة لا تعد أبدًا بنتائج مستقبلية.
- يتفاعل مع كل شيء آخر. يتم تشويش الانحراف بسبب تحركات السوق العامة، وتدوير القطاعات، والعامل الإخباري التالي، ومدى ازدحام السهم بالفعل. نمط في البيانات الإجمالية ليس توقعًا عن الشركة التي تنظر إليها.
الدرس المفيد من PEAD ليس "اشترِ كل مفاجأة إيجابية." بل هو أن المفاجأة الحقيقية غالبًا ما تعكس معلومات لا يزال السوق يمتصها — لذا يمكن أن تكون الأيام بعد التقرير مفيدة مثل التقرير نفسه، ونادرًا ما يحسم تحرك السعر في فترة بعد الظهر القصة.
كيفية قراءة مفاجأة الأرباح مثل المحلل#
اجمع الأجزاء معًا وستظهر عادة قابلة للتكرار. عندما تعلن شركة ما، لا تتوقف عند "مفاجأة إيجابية" أو "مفاجأة سلبية." اسأل:
- مفاجأة إيجابية أو سلبية مقابل ماذا؟ الإجماع، بالتأكيد — ولكن أيضًا الرقم السري وتوقعات الجانب الشرائي الحقيقية، بقدر ما يمكنك قياسها من حركة الأسعار والمشاعر قبل التقرير.
- ماذا فعلت التوجيهات؟ هل تم رفعها، تأكيدها، أم خفضها؟ عادةً ما يكون هذا هو المحرك الأكبر للتفاعل. وزنها بشكل أكبر من الربع الذي تم الإبلاغ عنه للتو.
- هل كانت المفاجأة عالية الجودة أم منخفضة الجودة؟ هل كانت الإيرادات والهامش هي المحرك، أم كانت عمليات إعادة الشراء، ومعدلات الضرائب، والعناصر لمرة واحدة؟ تتبع EPS إلى العمل.
- كيف تصرف السهم قبل ذلك؟ اسم ارتفع بنسبة 30% قبل الطباعة يحمل بارًا أعلى بكثير من واحد تم بيعه لمدة شهر مسبقًا.
- ما هي حجم المفاجأة واتجاهها؟ المفاجآت الكبيرة والنظيفة هي الأكثر ارتباطًا بالاستمرار — مع تذكر أن هذا ميل، وليس وعدًا.
قم بطرح هذه الأسئلة الخمسة كل ربع سنة وستتوقف ردود فعل الأرباح عن الشعور وكأنها رمي عملة. لن تتنبأ بالتحرك، لكنك ستفهمه — وهو الهدف الفعلي. إذا كنت ترغب في بناء المهارات المحيطة بمفهوم واحد في كل مرة، فإن مركز تعلم Valarn والمعجم يشرحان التوجيهات، والهامش، وإعادة الشراء، وبقية المفردات التي يعتمد عليها تحليل الأرباح.
كيف تتعامل Valarn مع مفاجآت الأرباح#
هذا هو بالضبط النوع من القراءة متعددة الطبقات التي يصعب القيام بها يدويًا تحت ضغط الوقت — ولهذا السبب قمنا ببناء Valarn للقيام بالعمل كأداة بحث تعليمية. بدلاً من وجود ذكاء اصطناعي واحد يخرج "مفاجأة إيجابية = جيدة"، فإنه يعمل مع حوالي 25 محلل ذكاء اصطناعي متخصص عبر خمس فئات — البحث الأساسي، هيكل السوق، النقاش والمخاطر، الجودة المالية، والأحداث/القطاعات والماكرو — بحيث يتم فحص مفاجأة الأرباح من عدة زوايا في وقت واحد.
يقوم محلل المحفز بإطار المفاجأة مقابل الإجماع والتقويم القادم. يقوم محلل الجودة المالية بالتحقيق في كيف تم الوصول إلى الرقم — الطلب الحقيقي مقابل إعادة الشراء أو العناصر لمرة واحدة. يقوم محلل المشاعر بقراءة كيفية وضع السهم قبل ذلك. ثم لا يتم فقط متوسط هذه الآراء؛ بل تمر عبر نقاش منظم بين الثيران والدببة، حيث يجادل أحد الجانبين بأن المفاجأة إيجابية دائمة بينما يقوم الجانب الآخر باختبارها، قبل أن يقوم النظام بتوليف رؤية بحثية محايدة واحدة — إيجابية، إيجابية حذرة، محايدة، حذرة، أو سلبية. لا توجد تعليمات شراء أو بيع أو احتفاظ.
كل ادعاء واقعي — EPS المبلغ عنه، الإجماع الذي تم قياسه ضده، لغة التوجيه — يمكن تتبعه إلى ملف أو مصدر بيانات مرخص مع تاريخ ساري، لذا فأنت لا تثق أبدًا في رقم لا يمكنك التحقق منه. يحمل كل تقرير أيضًا درجتين من 0 إلى 100: درجة الثقة التي تعكس جودة وحداثة البيانات الأساسية (ليست توقع سعر)، ودرجة الاتفاق التي تظهر مدى تقارب المحللين. وبدلاً من هدف سعر واحد، تحصل على نطاق السيناريو (دب، قاعدة، ثور) مع سعر مرجعي ومستوى مخاطر. يمكنك تصفح تقرير عينة كامل لترى كيف يتم تأطير المفاجأة، أو سحب أي رمز لتوجيه نفسك قبل الطباعة التالية.
الخلاصة#
تقيس مفاجأة الأرباح النتائج الفعلية مقابل التوقعات — والتوقعات هي التي تقوم بالعمل الشاق. لهذا السبب يمكن أن تؤدي المفاجأة الإيجابية إلى انهيار سهم (سعره متضمن، توجيه ضعيف، أو مفاجأة منخفضة الجودة) ويمكن أن تؤدي المفاجأة السلبية إلى ارتفاع (مخاوف أسوأ، آفاق قوية، أو تأثير لمرة واحدة). يضيف انحراف ما بعد الأرباح تعقيدًا إضافيًا: غالبًا ما يستمر السوق في استيعاب مفاجأة حقيقية لأسابيع، على الرغم من أنه كميل موثق، لا يعد أبدًا وعدًا.
التحرك في يوم الأرباح ليس عشوائيًا وليس حول الرقم الخام. إنه يتعلق بالفجوة بين ما حدث وما كان يعتقده الجميع بالفعل. تعلم قراءة تلك الفجوة — مفاجأة إيجابية أو سلبية مقابل ماذا، التوجيه، والجودة — وستتحول التقارير الربع سنوية من مربكة إلى قابلة للقراءة. إذا كنت ترغب في رؤية الصورة الكاملة مجمعة لك، قم بتشغيل تقرير بحث مجاني وشاهد كيف تتجمع المفاجأة، والتوجيه، والنقاش في رؤية يمكنك فحصها فعليًا.
Valarn هي أداة بحث تعليمية، وليست نصيحة استثمارية. إنها لا تخبرك بشراء أو بيع أو الاحتفاظ بأي شيء، ولا شيء هنا هو توصية أو وعد بالنتائج. دائمًا قم بإجراء بحثك الخاص واعتبر استشارة محترف مالي مرخص.
Valarn
Research
فريق أبحاث Valarn

جرّب Valarn مجانًا
شغّل تحليلًا مدعومًا بالذكاء الاصطناعي لأي سهم — عادةً 5–20 دقيقة لكل تقرير.