
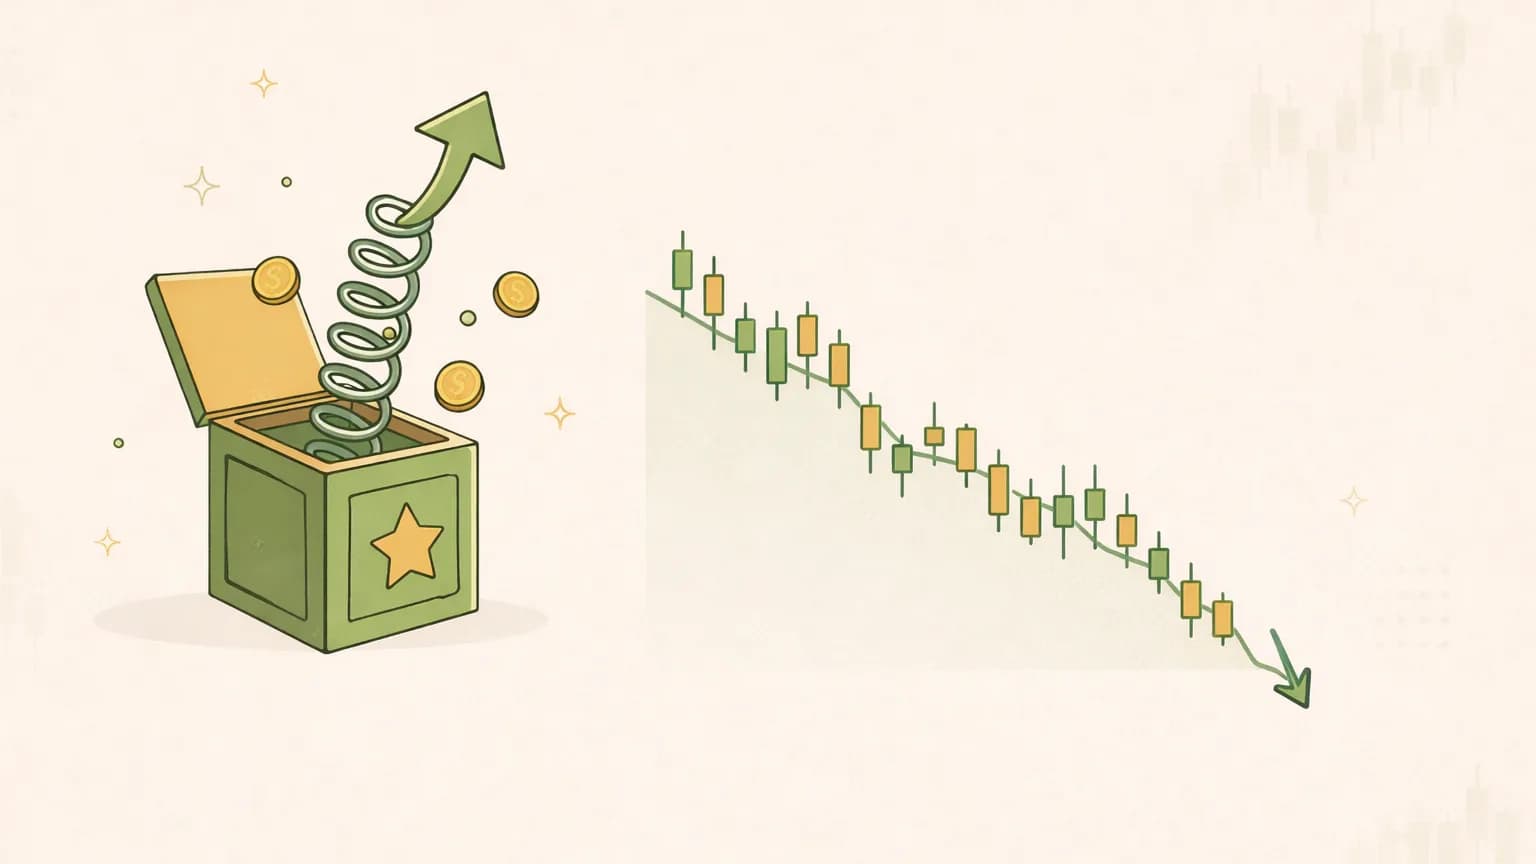
A company reports quarterly earnings, beats every analyst estimate on Wall Street, and the stock drops 9% before lunch. If you've ever watched that happen and assumed the market had lost its mind, you've run straight into the strange logic of the earnings surprise — one of the most misunderstood events in investing.
Here's the thing most people get backwards: the stock doesn't react to how good the numbers were. It reacts to how good they were relative to what everyone already expected. A blowout quarter that the market had fully anticipated can be a non-event, or worse. A mediocre quarter that came in less-bad than feared can rip higher. The number on the page is only half the story; the other half is the invisible bar it had to clear.
This guide explains what an earnings surprise actually is, why a beat can still tank a stock and a miss can rally, and what "post-earnings drift" means for the days after the report. The goal isn't a trading signal — it's to help you read an earnings reaction without being fooled by the headline.
What an earnings surprise actually is#
An earnings surprise is the gap between a company's actual reported result and the consensus estimate — the average of the forecasts published by the analysts who cover the stock. Most often it's quoted on earnings per share (EPS), though revenue and other line items get the same treatment.
The math is straightforward:
- Surprise (dollars) = Actual EPS − Consensus EPS
- Surprise (percent) = (Actual − Consensus) ÷ Consensus
Say the Street expected EPS of $1.50 and the company delivered $1.62. That's a positive surprise of $0.12, or 8% (0.12 ÷ 1.50 = 0.08). Come in at $1.41 instead and you've got a negative surprise — a "miss" — of $0.09, or about 6% below consensus. Those are illustrative numbers, but the arithmetic is exactly how the figure is built.
The consensus itself is just an aggregate of individual analyst models, and it's worth understanding how it's assembled before you lean on it — we unpack that in what an analyst consensus estimate is. The one-line version: consensus is the market's official expectation, and the surprise measures how far reality landed from it.
Why the number matters less than you'd think#
Markets are forward-looking pricing machines. By the time a company reports, its stock price already reflects a mountain of expectations — analyst models, management's prior guidance, industry data, and the collective guesswork of everyone positioned in the name. A lot of "good news" is priced in long before the press release hits.
So the reaction on earnings day is really a measurement of surprise in the literal sense: how much new information arrived versus what the crowd had already baked in. This is why two companies can post identical growth rates and see their stocks move in opposite directions. One cleared a low bar; the other tripped over a high one.
Keep that framing in mind, because it explains every counterintuitive move below.
Why a beat can still tank a stock#
A headline "beat" feels like it should be bullish. Often it isn't. Here are the three most common reasons a stock falls after beating estimates — the phenomenon we dig into further in why stocks fall after good earnings.
The beat was already priced in#
The published consensus is the official bar, but it's frequently not the real one. Ahead of a report, an unofficial, higher expectation circulates among traders — the so-called whisper number. If analysts publicly model $1.50 but the market is quietly bracing for $1.70, then a "beat" at $1.62 is actually a miss versus what people expected, and the stock sells off despite topping the official figure.
This gap between the stated estimate and the true expectation is one of the sneakiest traps in earnings analysis. It's worth understanding on its own, which is why we wrote a full explainer on the earnings whisper number. The practical takeaway: a beat relative to consensus tells you less than you'd hope, because consensus isn't always the bar the stock is trading against.
Guidance was weak#
An earnings report has two parts: what already happened (last quarter) and what management says is coming (guidance for the next quarter or the full year). Markets care far more about the future than the past. A company can beat on the quarter it just reported and then guide the next one below expectations — and the stock will follow the guidance down, because that forward number resets the whole thesis.
This is the classic "beat and lower" setup, the ugly cousin of the pattern you want, which is beat and raise — beating the quarter and raising the outlook. When you see a stock fall on a beat, the first place to look is almost always the guidance line. What management signals about the future routinely overrides what it just delivered; our piece on how company guidance works covers why that forward number carries so much weight.
It was a low-quality beat#
Not all beats are created equal. A high-quality beat comes from the engine of the business: more units sold, higher prices, expanding margins, real demand. A low-quality beat comes from everywhere else — a lower-than-expected tax rate, a one-time gain, aggressive share buybacks that shrink the share count and flatter per-share earnings, or cost-cutting that can't repeat.
The market usually sees through the low-quality version. If EPS beat only because the company bought back stock or booked a one-off item, while revenue stalled and margins slipped, sophisticated holders read that as a deteriorating business wearing a beat as a costume. The stock can fall even as the headline says "beat." This is exactly why reading the full report — not just the top line — matters, and why we built a step-by-step earnings report checklist to separate the two kinds of beat.
Why a miss can rally#
The mirror image is just as real. A company can miss consensus and still climb, and the reasons rhyme with the ones above:
- Feared worse. If sentiment was catastrophic going in — the whisper number was ugly, the sector was in freefall, short interest was heavy — a "less bad than feared" miss removes uncertainty. Relief buying does the rest.
- Strong guidance. A weak quarter paired with a confident, raised outlook tells the market the future is improving, even if the past stumbled. Forward beats backward.
- One-time drag. If the miss traces to a clearly temporary cause — a supply disruption, a delayed shipment that slips into next quarter, a legal charge — investors may look right through it to the underlying trajectory.
None of this means "misses are secretly good." It means the reaction is always actual versus expectation plus guidance, never the raw number in isolation. Once you internalize that, earnings-day moves stop looking random.
Post-earnings-announcement drift#
Here's the part that surprises people most: the reaction to an earnings surprise often isn't finished on report day. Researchers have documented a persistent tendency — studied since the late 1960s and known as post-earnings-announcement drift (PEAD) — for a stock to keep moving in the same direction as its surprise for weeks after the report. Big positive surprises have historically tended to drift up; big negative surprises to drift down.
The leading explanation is that markets underreact at first. Investors don't fully digest the new information in a single session, so the price adjusts gradually as analysts revise their models and more holders react. In efficient-market theory this shouldn't happen, which is exactly why PEAD is one of the most-studied anomalies in finance.
Two honest caveats, because this is where people get burned:
- It's a documented tendency, not a guarantee. PEAD describes an average pattern across many stocks over long periods. Any single name can do the opposite. It is not a rule you can mechanically trade, and past patterns never promise future results.
- It interacts with everything else. The drift is muddied by broad market moves, sector rotation, the next news catalyst, and how crowded the stock already was. A pattern in aggregate data is not a prediction about the company you're looking at.
The useful lesson from PEAD isn't "buy every beat." It's that a genuine surprise often reflects information the market is still absorbing — so the days after a report can be as informative as the report itself, and one afternoon's price move rarely settles the story.
How to read an earnings surprise like an analyst#
Put the pieces together and a repeatable habit falls out. When a company reports, don't stop at "beat" or "miss." Ask:
- Beat or miss versus what? Consensus, sure — but also the whisper number and the buy-side's real expectation, to the extent you can gauge them from pre-report price action and sentiment.
- What did guidance do? Raised, reaffirmed, or cut? This is usually the single biggest driver of the reaction. Weigh it more heavily than the quarter just reported.
- Was the beat high- or low-quality? Did revenue and margins drive it, or did buybacks, tax rates, and one-time items? Trace EPS back to the business.
- How did the stock behave going in? A name that ran up 30% into the print is holding a much higher bar than one that sold off for a month beforehand.
- What's the surprise magnitude and direction? Large, clean surprises are the ones most associated with follow-through — while remembering that's a tendency, not a promise.
Run those five questions every quarter and earnings reactions stop feeling like coin flips. You won't predict the move, but you'll understand it — which is the actual goal. If you want to build the surrounding skills one concept at a time, the Valarn Learning Center and the glossary break down guidance, margins, buybacks, and the rest of the vocabulary that earnings analysis leans on.
How Valarn treats earnings surprises#
This is exactly the kind of multi-layered read that's hard to do by hand under time pressure — which is why we built Valarn to do the legwork as an educational research tool. Instead of one AI spitting out "beat = good," it runs up to about 25 specialist AI analysts across five categories — Core Research, Market Structure, Debate & Risk, Financial Quality, and Events/Sector & Macro — so an earnings surprise gets examined from several angles at once.
A catalyst analyst frames the surprise against consensus and the upcoming calendar. A financial-quality analyst interrogates how the number was hit — real demand versus buybacks or one-time items. A sentiment analyst reads how the stock was positioned going in. Then those views don't just get averaged; they go through a structured bull-versus-bear debate, where one side argues the beat is durable and the other stress-tests it, before the system synthesizes a single neutral research view — Bullish, Cautious Bullish, Neutral, Cautious, or Bearish. Never a buy, sell, or hold instruction.
Every factual claim — the reported EPS, the consensus it's measured against, the guidance language — is traceable to a filing or licensed data source with an as-of date, so you're never trusting a number you can't check. Each report also carries two 0-to-100 scores: a confidence score that reflects the quality and freshness of the underlying data (not a price prediction), and an agreement score showing how much the analysts converged. And instead of a single price target, you get a Scenario Range (bear, base, bull) with a Reference Price and a Risk Level. You can skim a full sample report to see how a surprise gets framed, or pull up any ticker to orient yourself before the next print.
The bottom line#
An earnings surprise measures actual results against expectations — and it's the expectations that do the heavy lifting. That's why a beat can tank a stock (priced in, weak guidance, or a low-quality beat) and a miss can rally (feared worse, strong outlook, or a one-time drag). Post-earnings drift adds a further wrinkle: the market often keeps digesting a genuine surprise for weeks, though as a documented tendency, never a promise.
The move on earnings day isn't random and it isn't about the raw number. It's about the gap between what happened and what everyone already believed. Learn to read that gap — beat or miss versus what, guidance, and quality — and quarterly reports go from bewildering to legible. If you'd like to see the whole picture assembled for you, run a free research report and watch how the surprise, the guidance, and the debate come together into a view you can actually inspect.
Valarn is an educational research tool, not investment advice. It does not tell you to buy, sell, or hold anything, and nothing here is a recommendation or a promise of results. Always do your own research and consider consulting a licensed financial professional.
Valarn
Research
Valarn Araştırma Ekibi

Valarn'ı ücretsiz deneyin
Herhangi bir hisse için yapay zekâ destekli analiz çalıştırın — rapor başına genellikle 5–20 dakika.